


For the past month, Covid concerns have been replaced by interest rates and inflation as the new worries for the financial markets. Even with all this wall of worries, the market has been able to hit new highs as of this week (all except the Nasdaq). The interesting bit here is that there also have been several discussions of a topping or bubble in the financial market. So, for any investor, there is a lot to digest and it seems that at every corner there is a media trying to explain the next worrisome event coming for the market.
Let's see what the market is telling us from a technical standpoint.
Big Picture
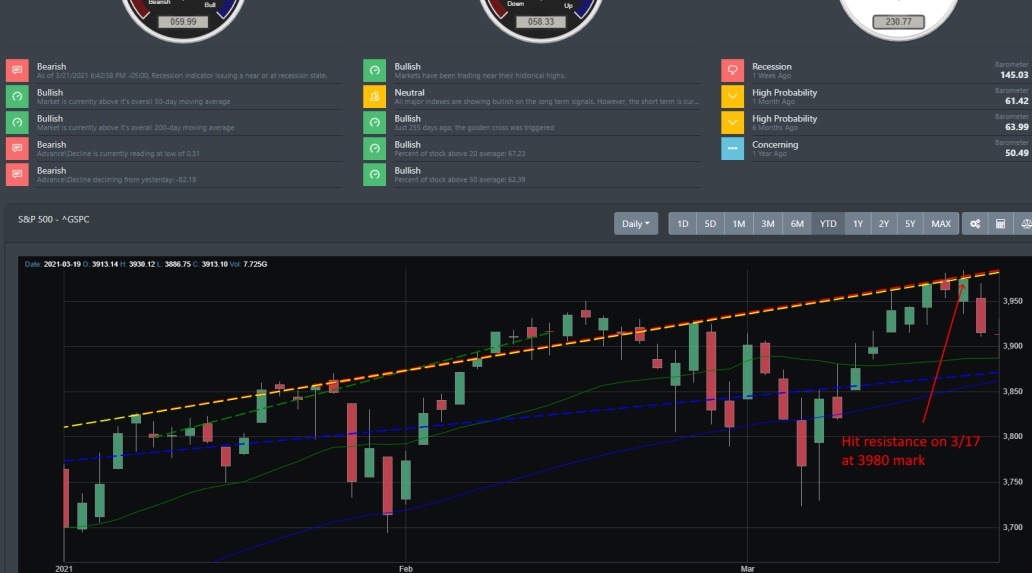
We are clearly still in a bullish market. The big picture uptrend is still strongly intact with major technical indicators on the large time frames indicating a strong bull market. Most major indexes including the S&P 500, Dow, and Russell 2000 hit a new high this week. Nasdaq did lose some steam to the trade rotation but it has been the solid winner since the March lows of 2020. Looking at the chart below, you can see that there is resistance right below the 4000 line for the S&P 500 and for the past couple of months the 50 DMA (blue solid line) has been tested twice. Most major indexes are well above their 20 and 50 DMA indicating the market is still in a solid uptrend.
Market Breadth
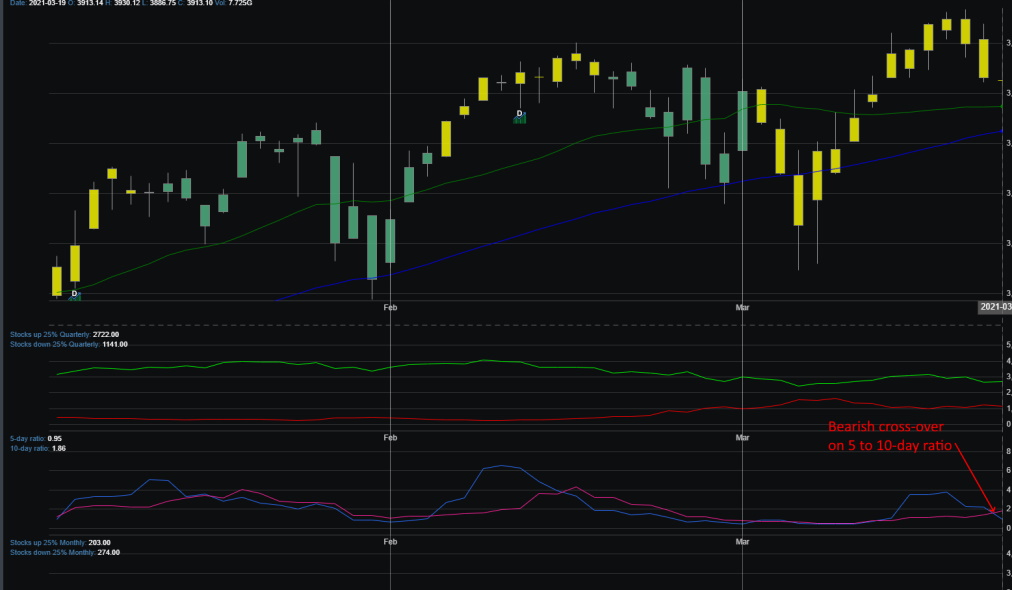
Market breadth is still showing strength as a good percentage of stocks are well above their 50 and 200 EMA. There could be a potential dip as showing on 3/19 in the image below. The 5-day ratio dip well below the 10-day ratio indicating a bearish crossover.
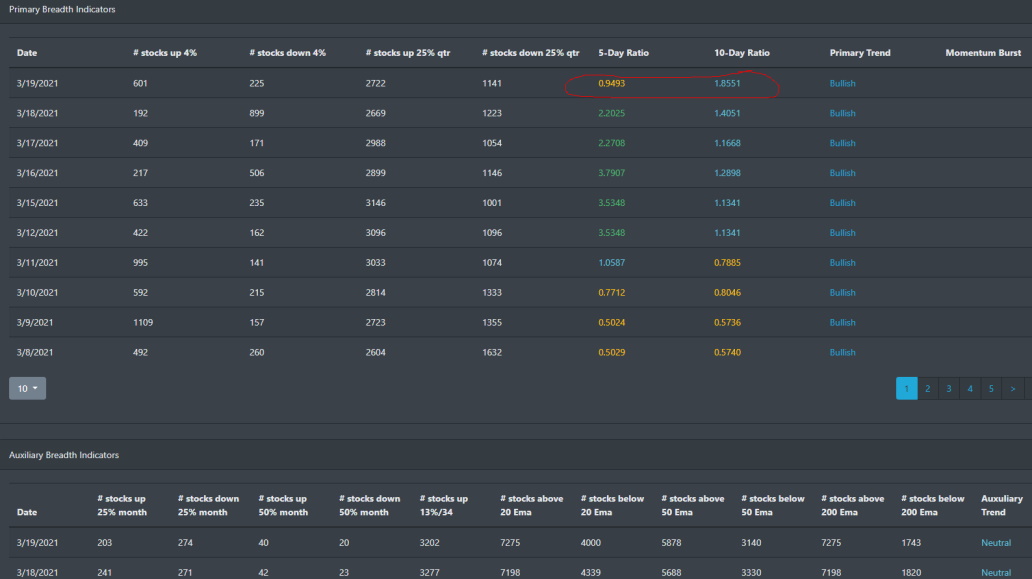
Market breadth showing the 5 to 10-day ratio bearish cross-over hitting on Friday 3/19/2021.
Market Sentiment
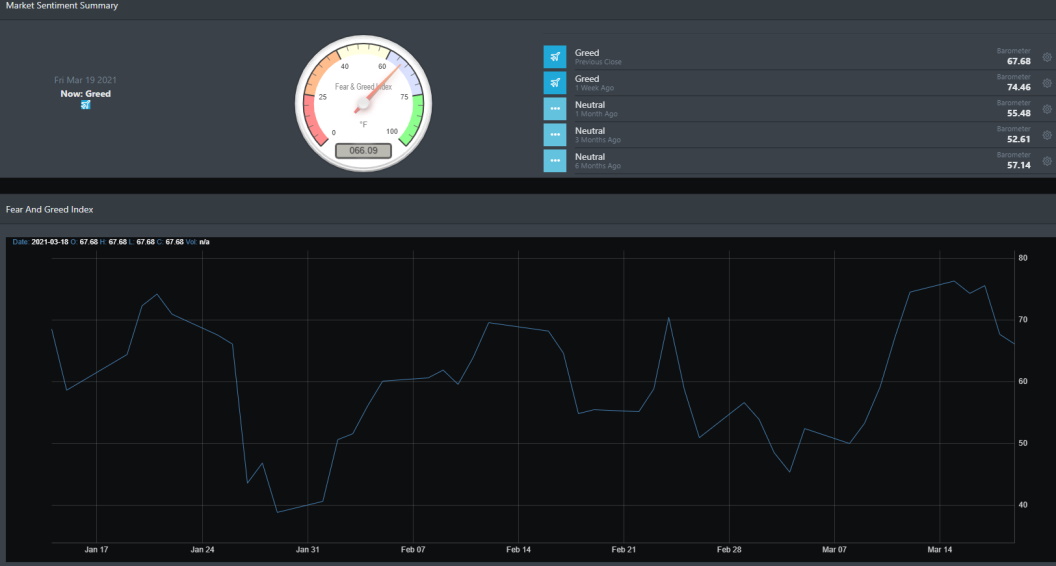
Market sentiment is currently reading a Greed and down from last week's high of 74.46. As mentioned in our last blog, when our index hits 65 or above, we expect to see volatility or a drop in the market in the next ensuing days. This clearly has happened this week with the market making new highs before closing out the week with negative readings. At a current reading of 66.09, we expect to see some more volatility coming this week.
Economic Outlook
All for except the labor market, most macro indicators are strong and some are above pre-pandemic levels. The long leading indicators show earnings for corporations rebounded in the 3Q20 and a majority of corporations recently posting solid earnings for 1Q21. The monetary conditions are flowing with money from the Fed QE policies. The money flow index is continuing to expand while the major financial stress indicators at all-time lows.
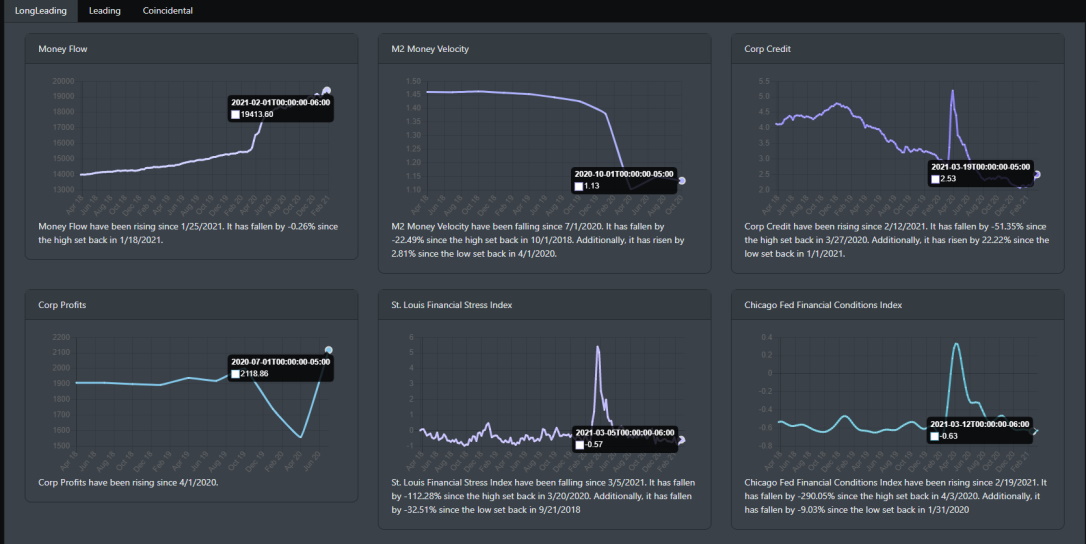
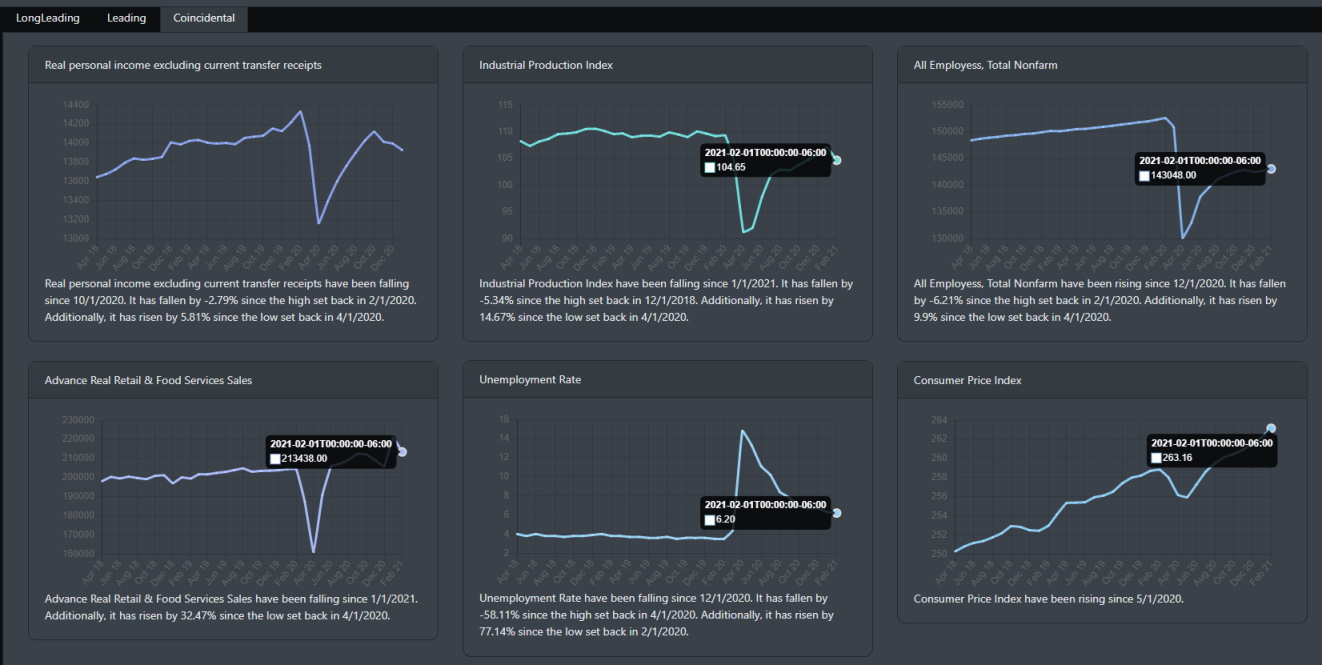
With Federal stimulus support, we can that the coincident indicators are showing strong signs of a recovery. retail sales are above pre-pandemic levels and personal income has also rebounded. The major outlier here is the labor market where unemployment is still at 6.2% and all employee levels have not fully recovered.
Market Outlook
Despite the volatility in the markets, the S&P 500 closed ou the week at 3920. The treasury market (TLT) on the other hand is in a major downtrend as bond investors are betting on inflation to rise as the U.S economy gains strength from the re-opening.
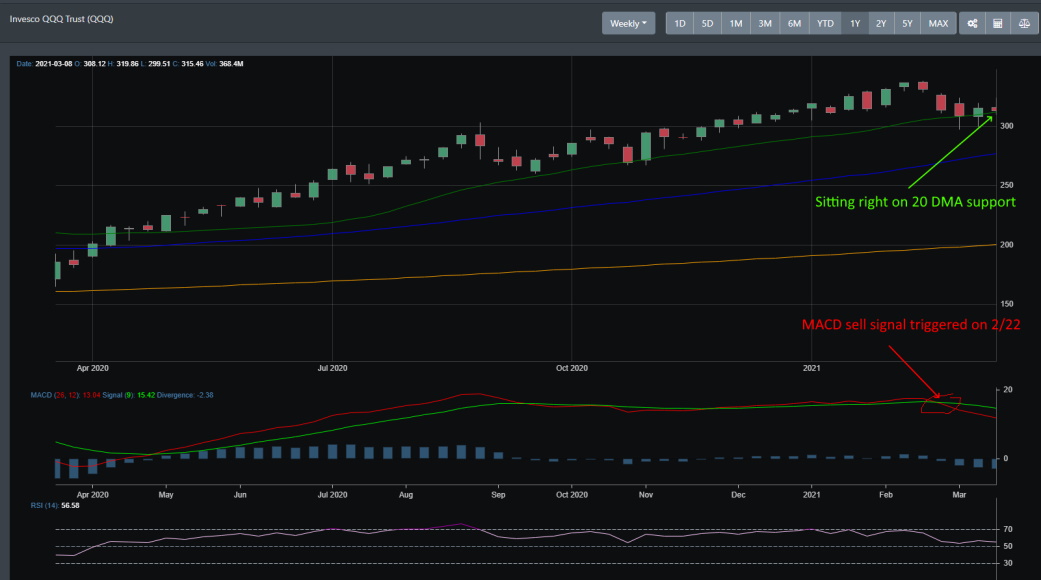
QQQ weekly
Tech was a primary index leader in 2020 due to the economic lockdown. Being mostly composed of tech companies, the index rallied to over 105%. For the past month, the weekly chart is indicating a bearish signal with the MACD sell signal being issued back on 2/22. Volume has spiked for the last few weeks and the index is currently sitting on its 20 DMA.
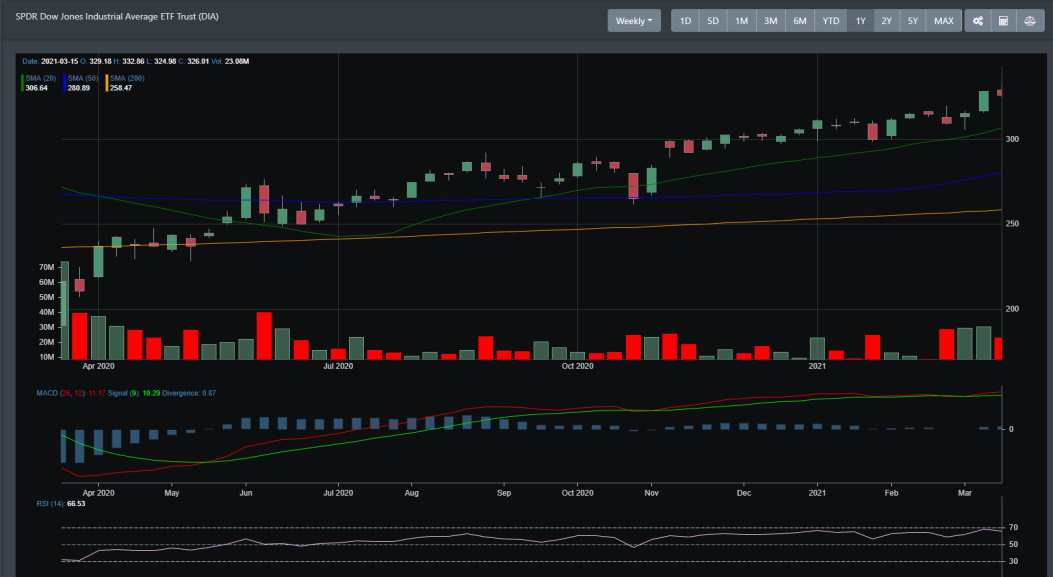
DIA weekly
The Dow Jones index is still in a major uptrend and has been a strong performer with the recent rotation trade.
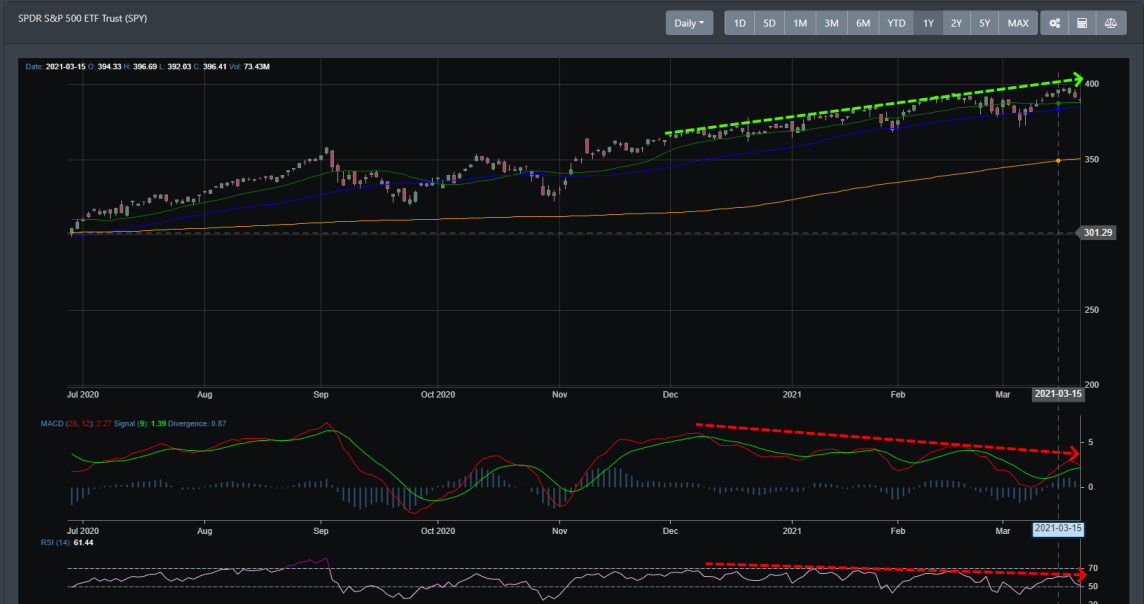
SPY daily
SPY on the daily has an interesting look to it. There is a negative divergence showing on the MACD and RSI indicators. This negative divergence shows up when price action for an index continues to make new highs while the technical indicators trend lower. Could this mean a sell-off is coming in the near term?
Concluding
All of the major indexes were negative for the week with inconsequential losses. However, all major indexes other than the Nasdaq posted new highs for the week. Despite the news of bubbles and topping patterns, this is still a solid week for the bulls. With small caps and value stocks currently leading the way, the current market is still positive for the year. Large caps may be losing steam but they have been on a rampage for the last 12 months. There may be a dip coming but overall the bulls should be ready for the next leg higher.