


As it now sits, this bear market has cleared out all the gains from 2021. And this Friday, all major indices tested their June lows with a small bounce going into the close. The financial markets have been on the downside for most of the year with recent rallies lasting just a day and then selling off not too long after. Any follow-through from the "buy the dip" crowd has now been replaced by "sell the dip". For the week, all major indices underperformed. The S&P 500 was down 4.65%, Nasdaq was down over -5%, and the Russell 2000 was down over -6%. After the Feds hiked rates by the expected 75 basis points, stocks responded by dropping to June's low. With fears of a recession rising, investors sold out on technology and the consumer discretionary sectors.
In our last blog, we concluded with the following statement:"The recent rally has set up the indices at a crossroads. With the weekly sell signal still being triggered in late August, there is still downward pressure on the markets. However, the daily readings are now poised to turn bullish and potentially challenge its near-term resistance. If markets are able to consolidate near support and push higher, there is plenty of momentum to push markets higher in the next few weeks. However, if markets are unable to hold and break resistance, there is a chance that markets head lower."
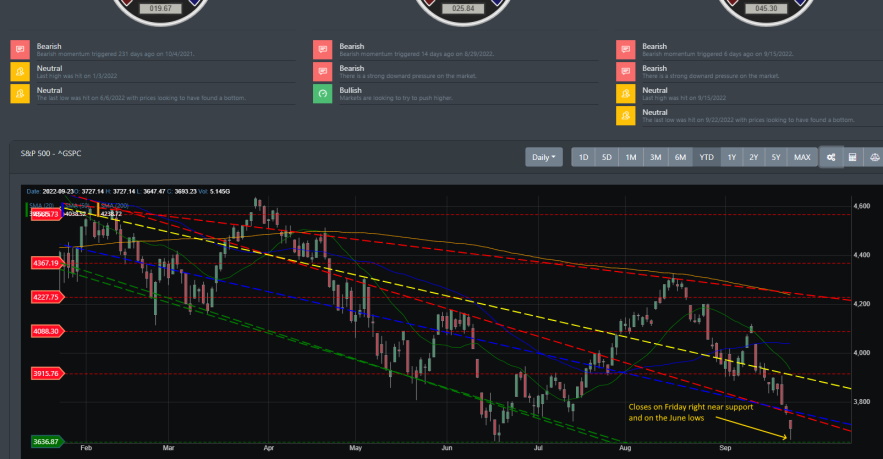
The rally that occurred a couple of weeks ago was unable to break through resistance near the 4088 region. It turned over and sold through into resistance at 3915 and now resting on the June lows.
Big Picture
Coming off the prior week when markets sold off from the CPI news, markets had an up day on Monday. The counter rally was only temporary as investors sold out in anticipation of the Fed rate announcement. Sellers came in and drove as Friday closed with another down week for the markets. This time the S&P 500 dropped to test support right near the 3636 region. There was a bounce from that support line but will it hold? Or will we see the "sell the dip" crowd come out in full force and drop the market lower?
Market Breadth
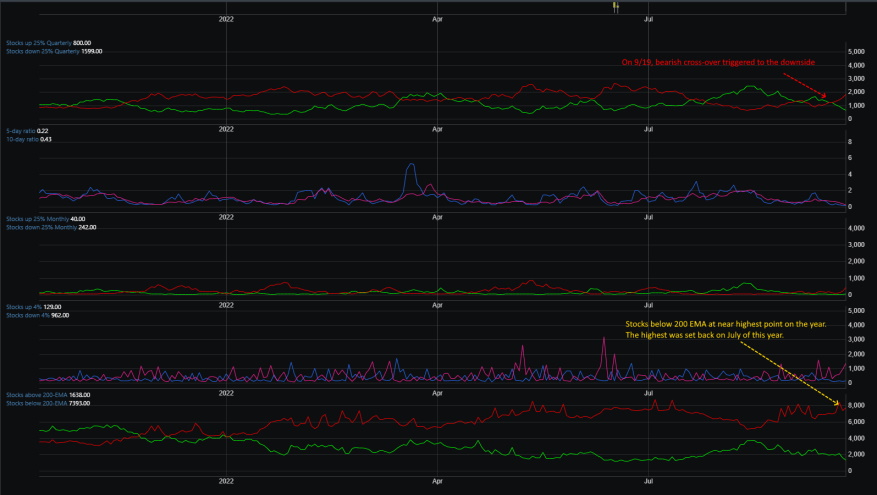
Since 9/19 of this year, market breadth internals has clearly turned bearish. Our data point for stocks up/down 25% quarterly provides a strong indicator for the overall market direction. Historically, when this indicator crosses over to the downside, markets sell off immediately thereafter. Also, make note of the indicator for stocks above and below their 200 EMA. The reading for stocks below their 200 EMA is enroaching on the high-end point for the year. This reading is currently at 7773 stocks below their 200 EMA. Conversely, stocks above their 200 EMA are at a dismal 1362 reading. Can market internals deteriorate any lower? Most likely not. Market breadth was at its worst in July but it also saw a similar weakness in May. However, we are near a point where the markets have technically moved deeply into the oversold territory. Based on the historical data readings we have developed, the market's internal data points are pointing toward a bottoming.
Market Sentiment
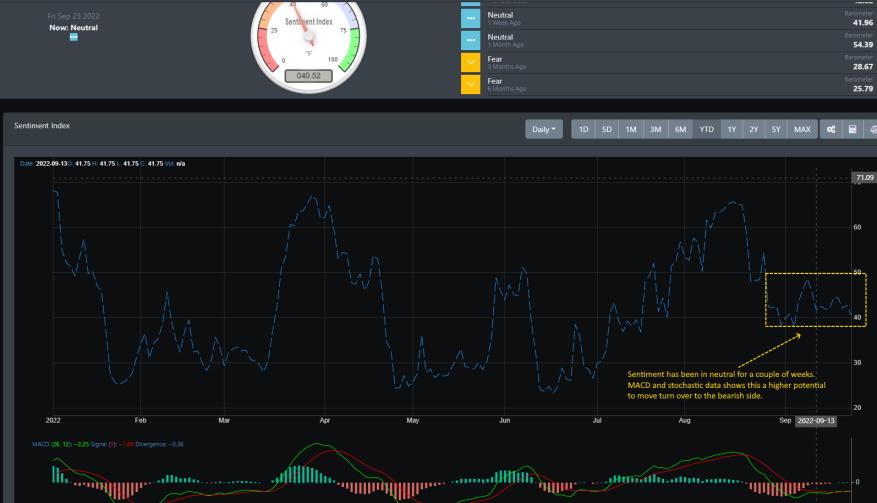
Sentiment has been mostly neutral for the past week but is borderline on the fear level. As of the close on Friday, the market sentiment indicator is at 40.52. Just shy south of moving into fear. The MACD has been steady without a clear indication of sentiment movement. This upcoming week should provide a true answer as the bulls and bears are set up for a fight on the June lows.
Market Outlook
All major ETF indices finished the week off near the June lows. SPY had a bounce off of that support near the late afternoon hours on Friday. However, it was clear that investors are not taking the fear of a recession and Fed's hawkish view of controlling inflation lightly. The index sellers are now looking at the markets where SPY touched near the 362 support region. Can markets move lower? Let's take a look at the bigger timeframes to see how much pressure is currently in the markets.
SPY
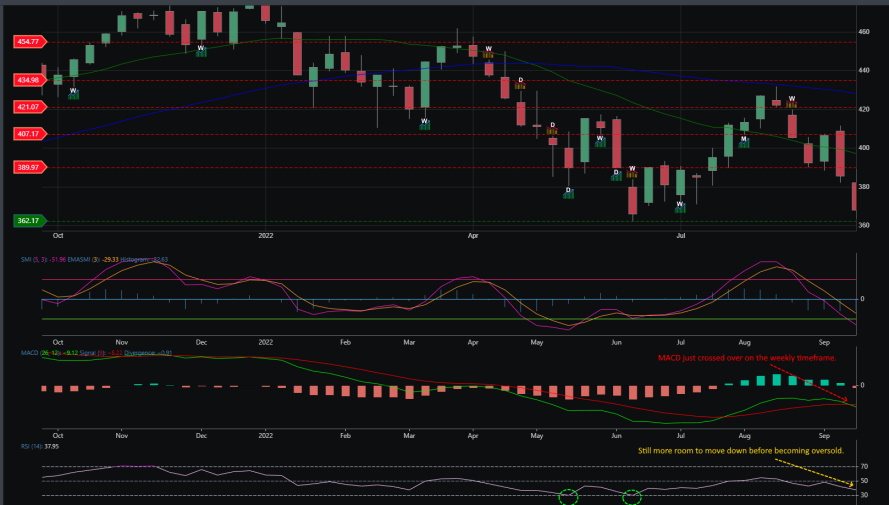
The weekly chart paints a picture of more downside selling to come. Having broken through the 389 support a week ago, it now has rested on a key support level of 362.17. The MACD triggered a bearish crossover this week. While the daily readings are in oversold territory, the weekly chart suggests there is still downward pressure in the markets. Take a look at the two green circles marked on the RSI indicator for the SPY chart. When RSI levels hit this low on the weekly readings, it suggests markets are highly oversold. And as we can see for this year, a counter-rally would start once this reading hits into that oversold region. Though trending lower, RSI has yet to hit that marker which suggests markets still have more room to head lower.
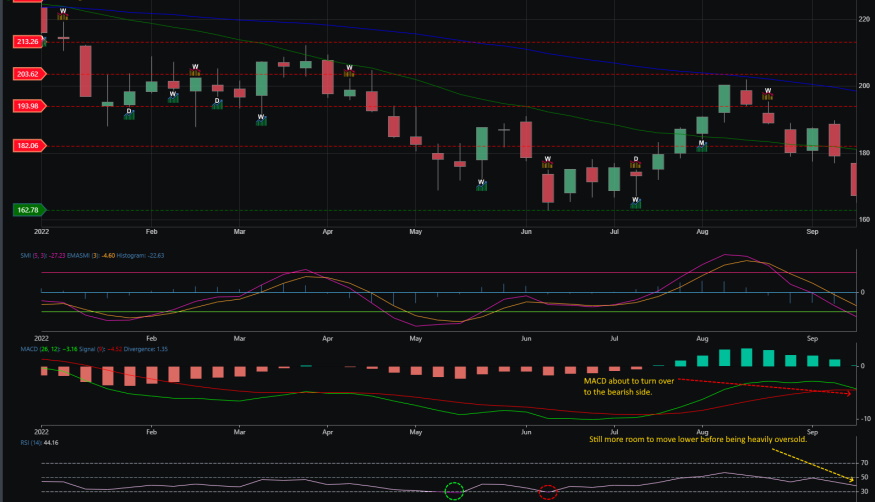
QQQ
The weekly MACD on QQQ is ready to turn over to the bearish side. And like SPY, the weekly RSI levels have not triggered into the oversold territory. If the MACD turns over to the downside, RSI will move down as well and that implies that more selling is set to come.

IWM
Like QQQ, the MACD is poised to cross over to the downside with the weekly RSI still in a downtrend. A bearish crossover on the MACD will move the RSI lower and take IWM prices down with it.
Concluding
With the break of the support region near 3915 on 9/15, we were expecting markets to move lower but the potential to retest the June lows was quite abrupt. When looking at the daily readings, markets are in deeply oversold territory. However, we do not expect a big bounce coming for this week as the weekly readings are suggesting more immediate downside pressure. There is now a higher probability that the markets break their June lows. Can the bulls stage a counter-rally? Most likely not. They have been unable to sustain momentum all year long.