


Well, how about that for the September market "correction"? A couple of months ago, there were several bearish articles suggesting a market correction would beget the market. Here are but just a few of those bearish articles that had dire warnings for investors:
Morgan Stanley Sees Growing Risk of 20% Drop in S&P 500
The Six Largest Wall Street Banks Issue Market Red Alerts
Bearish trend signals stocks are vulnerable to a 10% to 15% correction
A stock market correction may be right around the corner
We could go on but you get the idea. These are quite bearish readings from just a month ago. Imagine how confusing and fearful this can be for an investor that is guided by market news and analyst predictions. The S&P 500 in closed August sitting at 4522. Many bearish articles came out during the Summer and well into early September issuing warnings that a market top was going to drop the stock market. Well, since this warning came about, we did have a market dip. And as we discussed last week in our blog, that market dip was about 5%.
So, where is the market now since the dire warnings issued by major banks and market pundits? The S&P 500 closed Friday sitting at 4471. It is now 1% off its most recent market high. Clearly, reading market headlines can be very unprofitable if someone were to try to short the market or get out all in cash. There was not much of a correction in sight but a perfect buy-the-dip opportunity for investors. In fact, all major indexes traded up over 1%. Nasdaq posted +2.46%, Dow Jones made +1.64% and the Russell 200 was up +1.45%.
And how about the start of Q3 earnings? More than 80% of the 41 S&P 500 companies have reported earnings that beat analysts' expectations. One of our comments from last week's blog was that we expected earnings to be a boom for pushing the market higher.
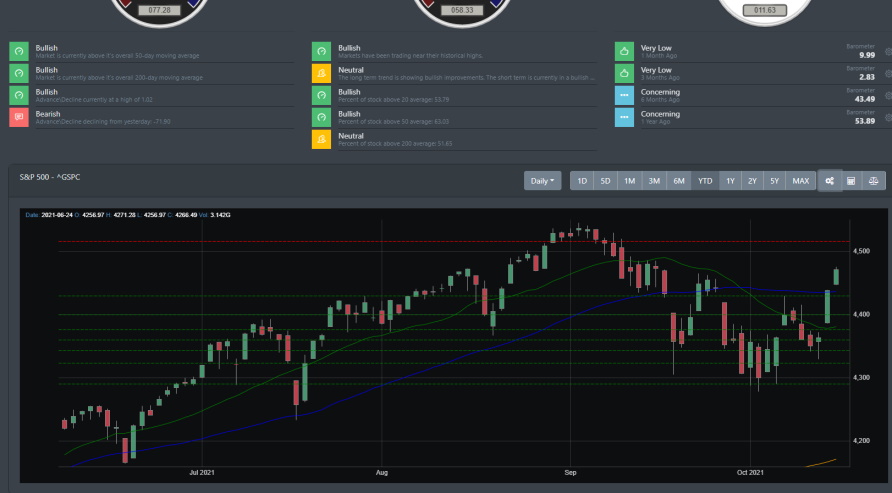
Big Picture
Last week we discussed that if the S&P 500 could hold the support region around 4369, then there is a high probability that there will be a near-term rally to follow. Well, this week that was certainly the case as the S&P 500 held support and pushed through initial resistance at 4425. The S&P 500 is now sitting at 4471. The week started off negative as the S&P 500, Nasdaq, and DJIA posted three consecutive losses. However, by the end of the week, the bulls came out in full force and help push through the initial resistance as we discussed in last weeks blog.
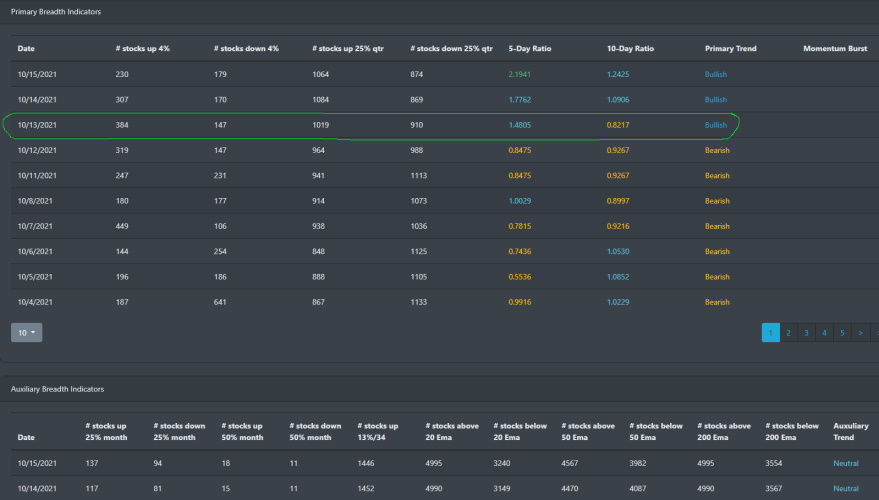
Market Breadth
Market breadth has been trending bearish for much of the Summer. While highs were being hit with all indexes, the number of market participants was trending lower. On Wednesday of 10/13, that all changed our market breadth data triggered a near-term bullish signal. The 5-day to the 10-day ratio of market participants crossed over to the bullish side. It is still too early to tell if this will trigger our momentum burst buy signal but it is clear that market breadth data is turning positive.
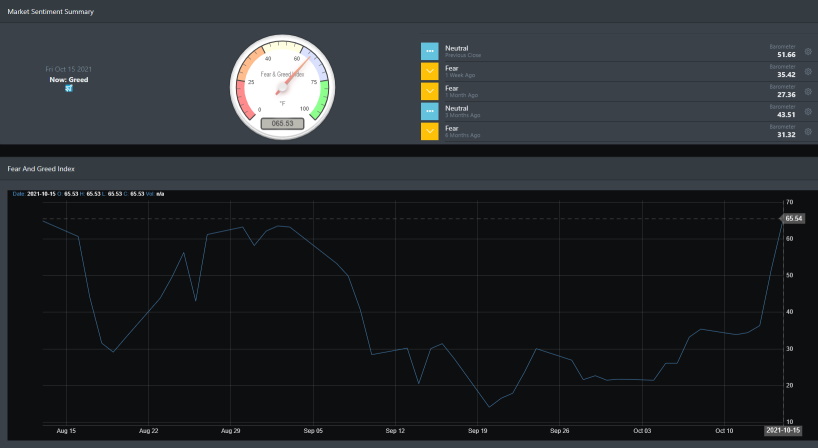
Market Sentiment
Euphoria hit the investors this week sending our market sentiment index to a near all-time high of 65.53. Markets sentiment has been bearish for the past few weeks. It was only until Thursday did we see a major uptick in the index. Readers should be wary that typically once the index hits this high, it normally does not stay in this trend. Historically, once the index hits this level, it usually tapers down and we see a minor dip in the market. You can find this in the historical market sentiment data for June 10th where the index hit 66.80, July 1st where the index hit 63.46, and August 13th where the index hit 64.98. On each of those occasions, when the index hit its high marker of 60+, there is a dip in the following week.
Market Outlook
For the most part, markets were still hovering near support to start the week off. With the financial institutions posting upbeat earnings reports and the backdrop of a low tax for corporations, investors found their winds in their sail and help push the market up near its all-time high.
Let's look at the market from year to date.
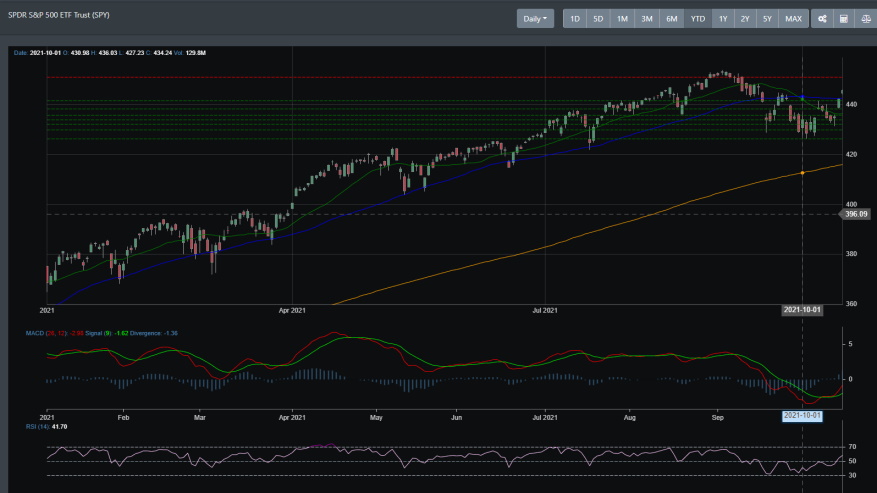
SPY
SPY had a strong break out this week and is above its 50-DMA. It did dip to start the week off but was able to bounce back during Thursday and Friday to push above its near-term trend line. The daily timeframe for this year clearly indicates SPY had a bullish trend for much of the year. Dips are par for the course when in a bull rally. This current dip is much needed.
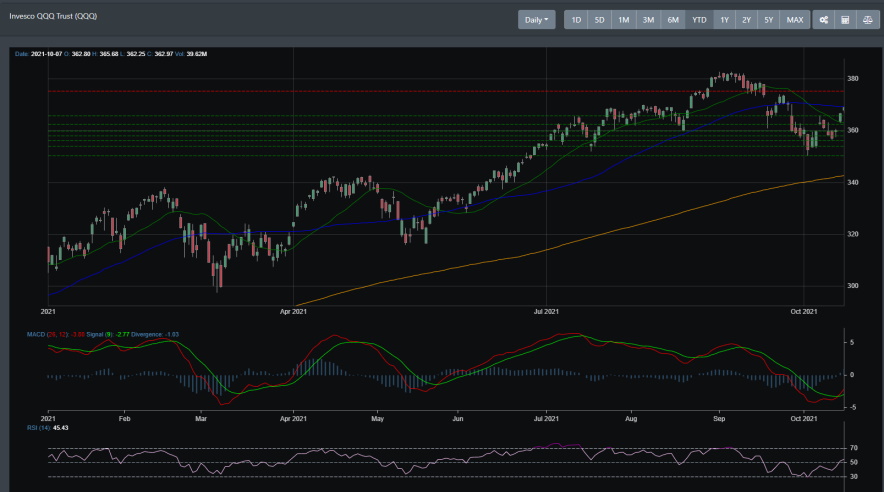
QQQ
Like SPY, QQQ traded lower to start the week off but then broke through its 50 DMA resistance line to close out Friday's trading session. QQQ trended sideways for parts of Q2 but rallied up until recently.
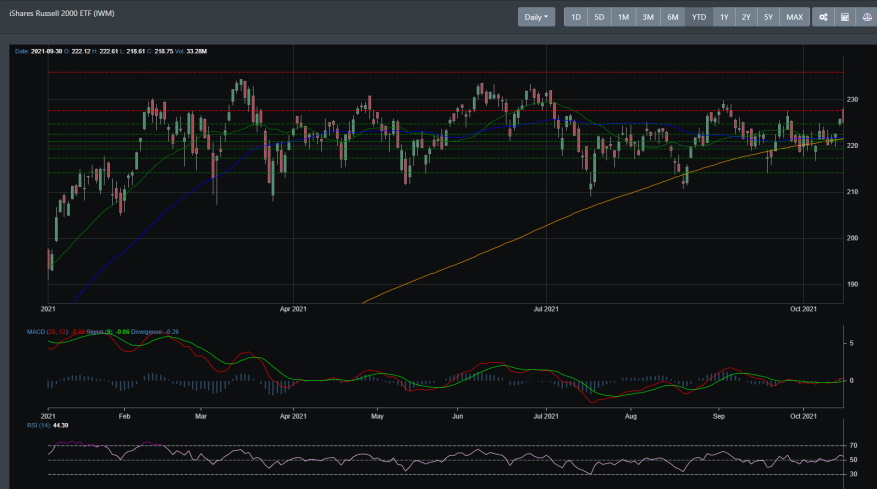
IWM
IWM continues on its consolidation pattern. It has been trading between 280 and the 240 range for most of the year. It closed the week on a positive and is right near resistance.
Concluding
The bull rally is still very much alive and the recent market dip was a perfect buying opportunity for investors. As we discussed in our last blog, there was a high probability that markets will push higher in the coming week. That did happen this week and we are now sitting at a point where the market could propel higher or drop back to support near the 4200-4300 region. This coming week will help answer whether this recent rally is a corretive rally or an indicator that markets are ready to start pushing higher to close out the year. If markets are able to push past 4500, then there is a good chance that it will challenge the recent all-time high this week.