


In early February, the S&P 500 was trading above 3,884 and right now it looks like the market is blowing off some of that steam. With excessive speculation among investors and signs of an economic opening, markets pushed higher for the last few months. This past week, rates jumped higher which sparked inflation fears. U.S. government bond yields are on the rise with the yield on the 10-year Treasury note pushing over 1.5% (February 25). One thing to consider is the spike in Treasury yield signifies that a full economic recovery is likely to occur in the near future. Jerome Powell and the Feds are steadfast in ensuring that QE is here to stay. Earlier this week, Jerome Powell stated that the Feds will keep the pedal to the metal when it comes to monetary stimulus. The Feds also downplayed the inflation worries and promise to promote more monetary policies to support economic growth. This has an adverse effect in that the bond market is now selling off.
Big Picture
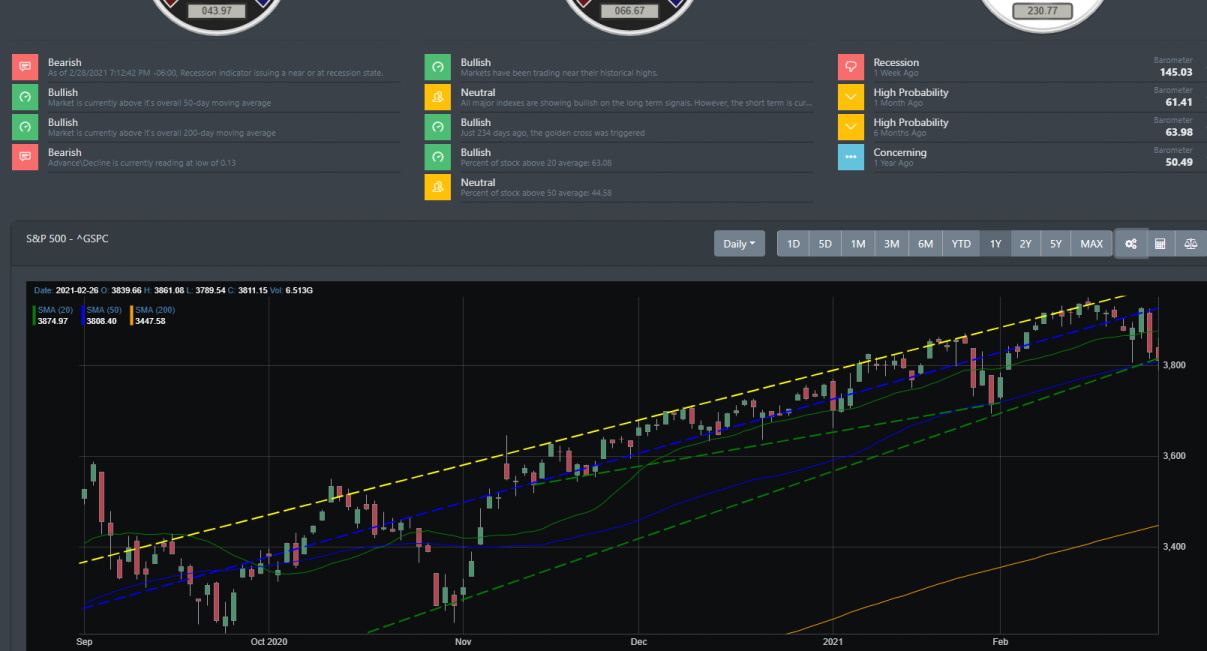
About a year ago, the S&P 500 closed at an all-time high of 3386 before COVID-19 hit. On Monday of this past week, investors woke up to find that the 10-year Treasury hit a one-year high of 1.37%. Relatively speaking, rates are still considered below the normal average. However, it was the acceleration of the rising rate that caused a knee-jerk reaction in the markets. The Nasdaq composite took a hit and fell more than 4% on the week. Right now, as it stands we can see the S&P 500 is sitting right the 50 DMA support trend line.
Market Breadth
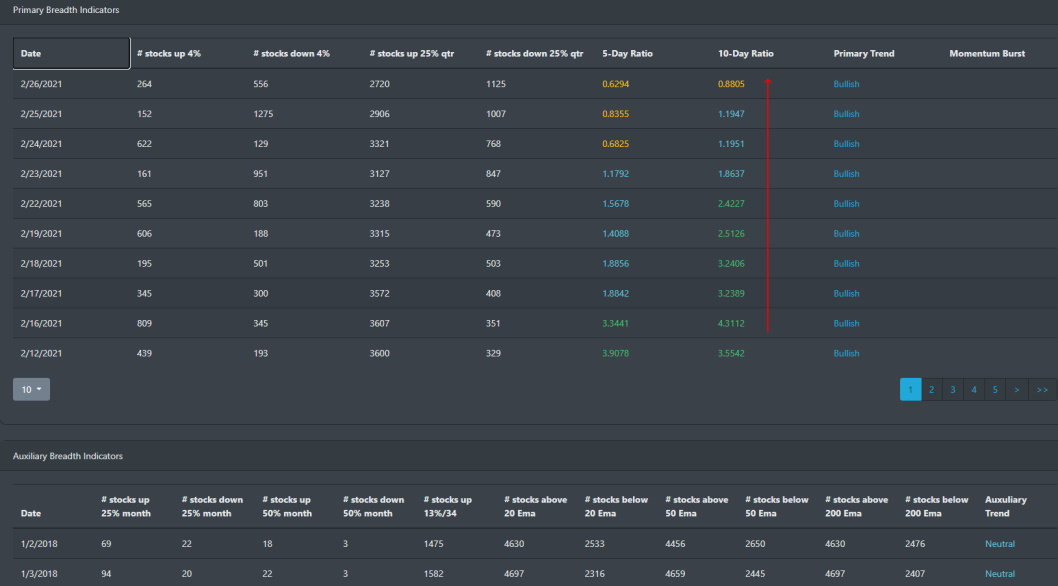
Market breadth started slowly grinding to a bearish signal right around 2/16. We can see from the table below that the 10-day ratio of stocks above their 25% started slowing down. With news of inflation worries, this picked up steam and caused further selling on 2/23.
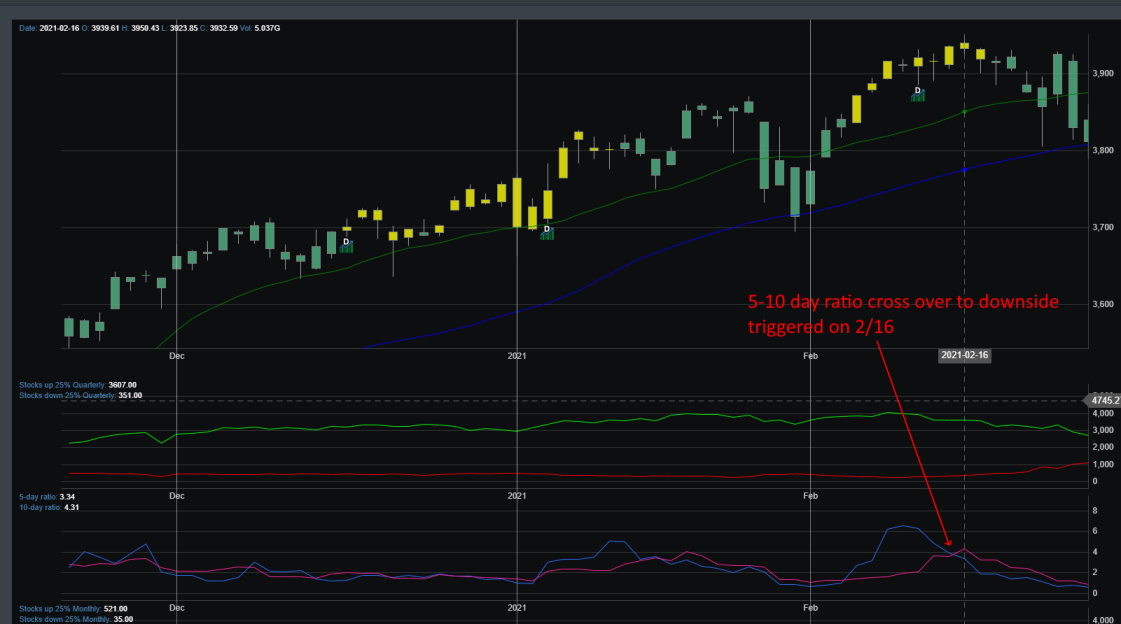
There was a sell signal triggered on 2/16 when the 5-day ratio and the 10-day ratio crossed over. From there we can see that it picked up steam as markets started to sell-off.
Market Sentiment
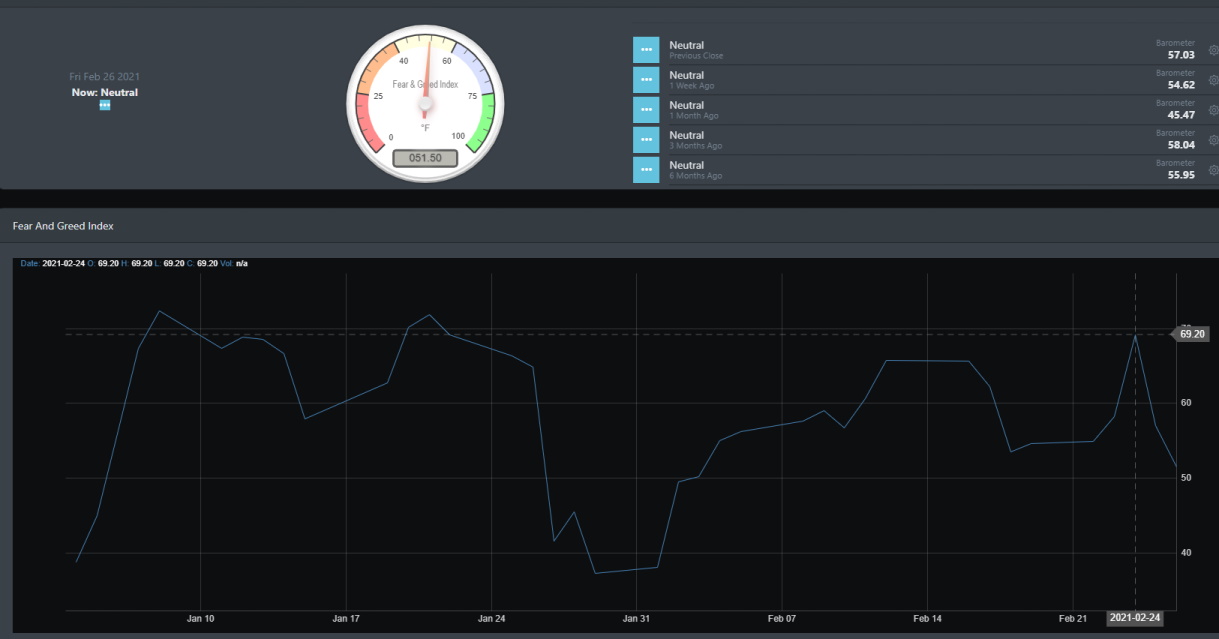
Extreme speculation among investors has helped propelled the market for the past few months. We can see this in January and February alone with BullGap's market sentiment index hitting highs on 4 separate occasions. Historically, when the index hits above 65, it usually sees a drop in sentiment over the next few days. This usually coincides with a temporary drop in the rally. You can see this evident on several occasions when the index hit 72.37 on 1/8/2020. S&P 500 dropped the day after. On 1/21, the index hit 71.86 and the S&P 500 dropped a few days later. And more recently, it hit 69.20 on 2/24 and the market dropped the following day. Though the market is currently in neutral territory, it is currently still in an overall market rally.
Economic Outlook
With COVID cases continuing to drop and vaccinations on the rise, the economic data is dramatically improving. There are even discussions that state lockdowns and the mandatory masks will be reduced in the coming weeks or months. As shown below, the 10-Year Treasury and 30-Year Treasury saw rapid ascent for the past month. Consumer confidence slightly beat estimates with a rise to 3 month high. These gains are most likely a reflection of stimulus rollout, vaccination distribution, and the easing of some pandemic restrictions.
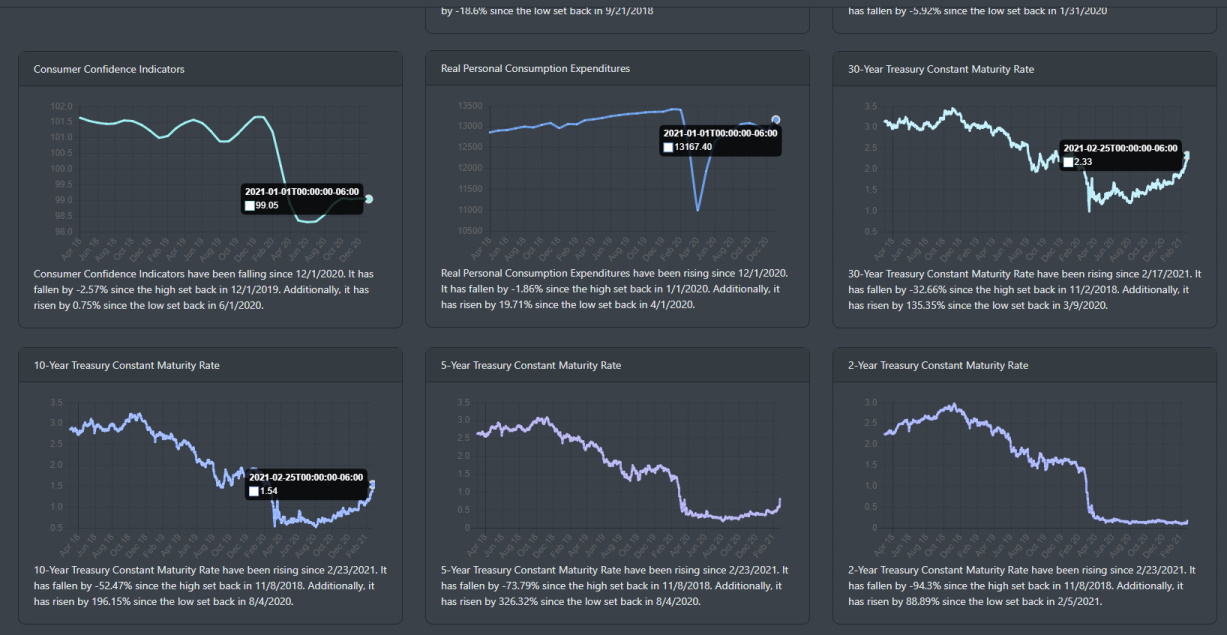
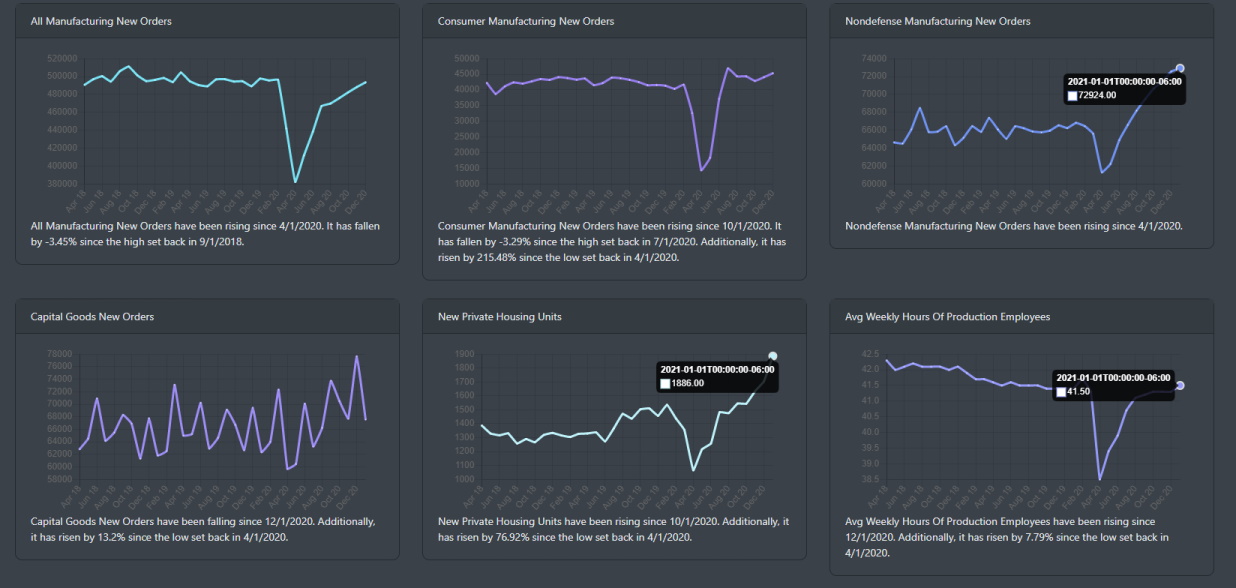
Durable goods and new orders less transportation continue to increase. They are well above the pre-pandemic levels. The housing market is on fire. Overall, economic data is pointing to a strong recovery. The only outlier here is the jobless claims which are most likely due to the economic lockdowns.
Market Outlook
This week we saw all major indexes in the red. Nasdaq dropped 5% and effectively erased a majority of its 2021 gains. The S&P closed down more than -2.45% while the Russell 200 dropped around -2.90%. When looking at the DAILY technical indicators, all signs point to a bearish correction. Let's take a step back and see how the markets look from a weekly timeframe.
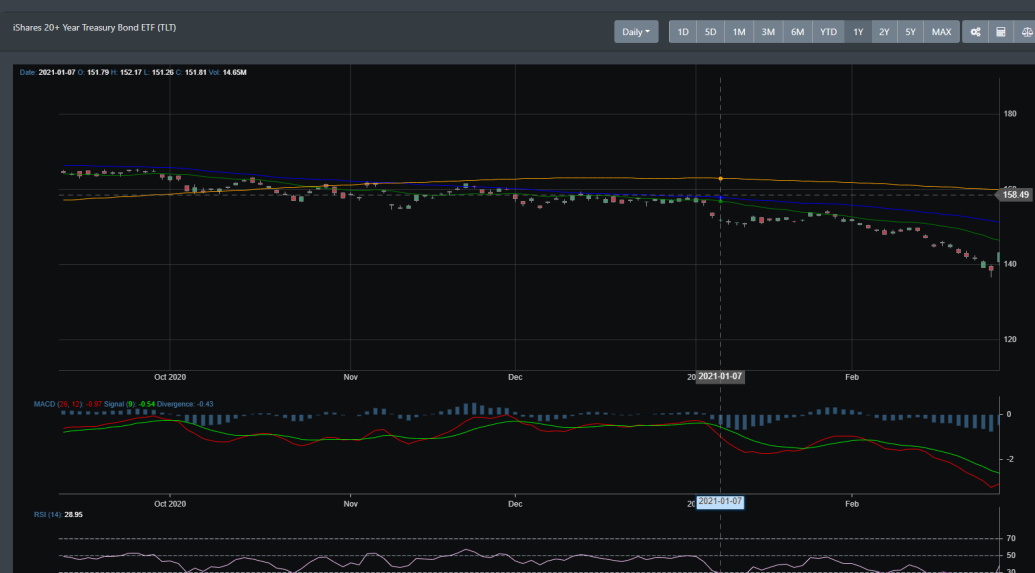
To start off, let's look at the bond market. From the chart below, we can see TLT selling off. This is most likely a direct reflection that investors believe growth is coming and this will lead to higher inflation.
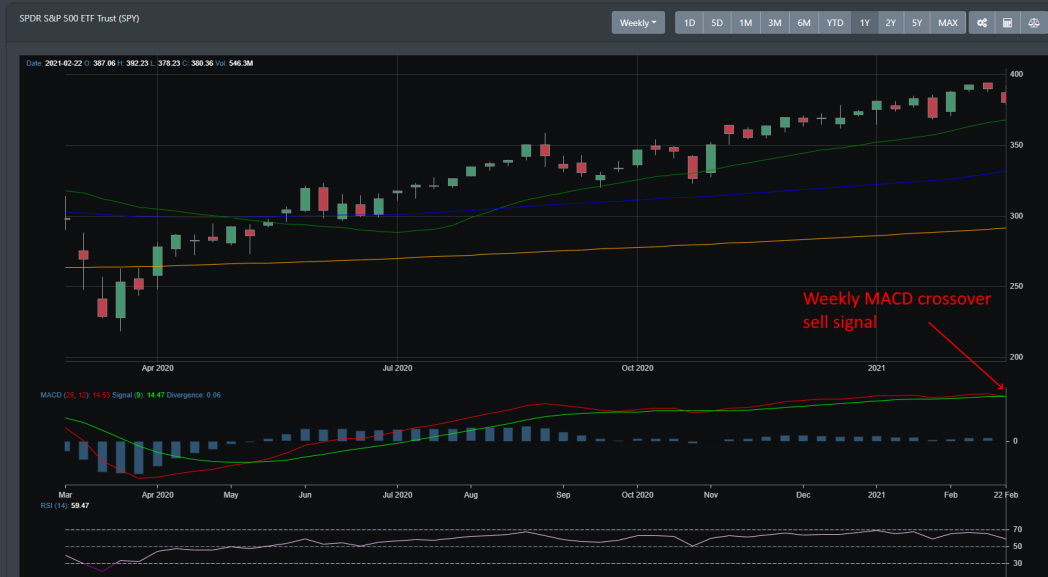
SPY weekly
From the weekly perspective, SPY is still in a bullish trend. It is well above its 50 and 20 moving average. There is MACD cross-over that just occurred on Friday and that may be a signal that more selling is likely to occur. If it does, expect the next test to be at the 20 moving average.
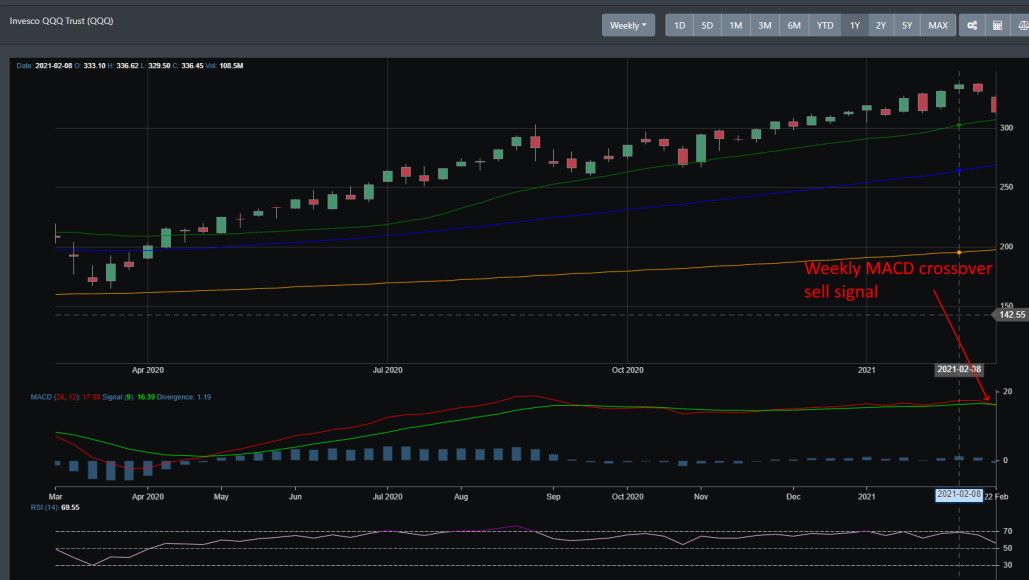
QQQ weekly
QQQ also posted a MACD cross-over sell signal on the weekly chart this week. The next test will be at the 20 moving average and after that, it has much farther to go down.
Concluding
It has been a volatile week with the S&P 500 sitting right on the 50 DMA support trend line. While some pundits are calling for a massive correction coming because of overvaluation and investor exuberance, we see an economy that is about to open. With trillions in excess liquidity already in the system, 1.9 trillion stimulus package almost ready to roll out, consumer balance sheet in excellent standings, huge pent-up demand, global trade about to open, majority of corporate earnings in the positive, and the Fed publicly stating it will keep QE going, we see only a market correction currently occurring in the market.