


Earnings are coming in strong for April and this upcoming week will be where we see results from big tech such as Apple (AAPL), Facebook (FB), Tesla (TSLA), and Amazon (AMZ). The S&P 500 is hovering north of 4100 and there has been a lot of discussions lately with overvaluation, market tops, and exuberant market participants. There seems to be an army of investors sitting on the sideline waiting for the next big correction. As we discussed in our prior blogs, the last 6 market dips have been bought up with each occurrence being narrower than the prior. Those waiting on the sideline for a market crash or big market correction may be waiting a little longer.
Big Picture
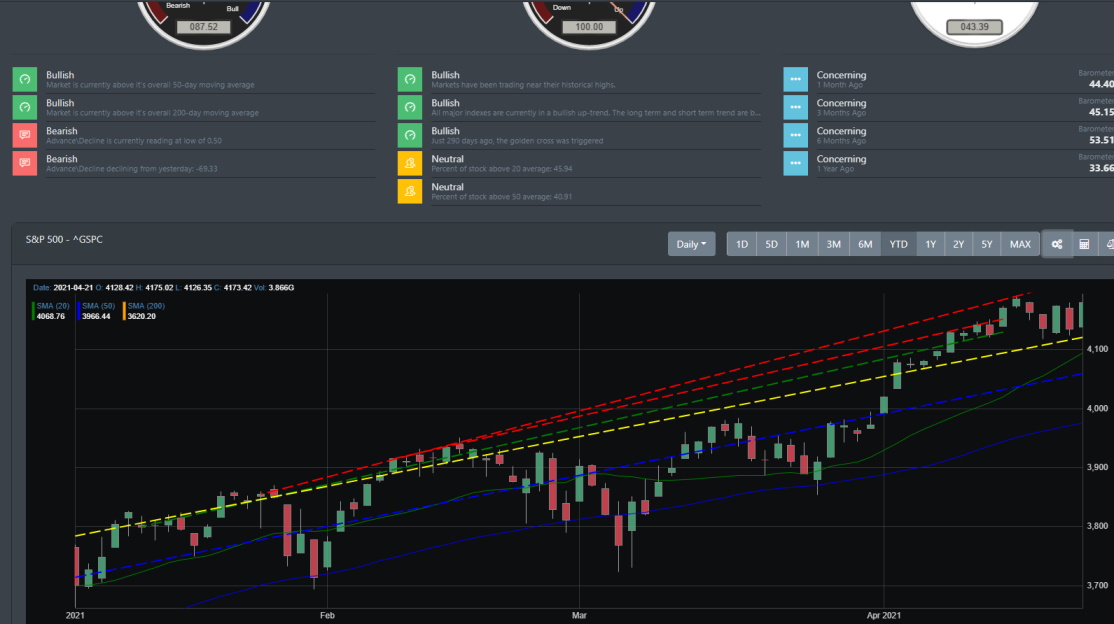
The S&P 500, Nasdaq, and Dow Jones all closed down less than 1% this week. The Russell 2000 was the only index to post a positive performance (+0.41%) for the week. The 4-week winning streak for t the S&P 500 ended on Wednesday when it posted back-to-back losses. Thursday saw a knee-jerk reaction from market participants who got nervous over Biden proposing to raise capital gains tax on the wealthy. Friday delivered with a strong rally that reversed the S&P 500 down day to a near 1% loss for the week.
All in all, the market is still in a major uptrend with the S&P 500 sitting right above the trend line (yellow dash). Markets are currently consolidating from the move higher on 4/16.
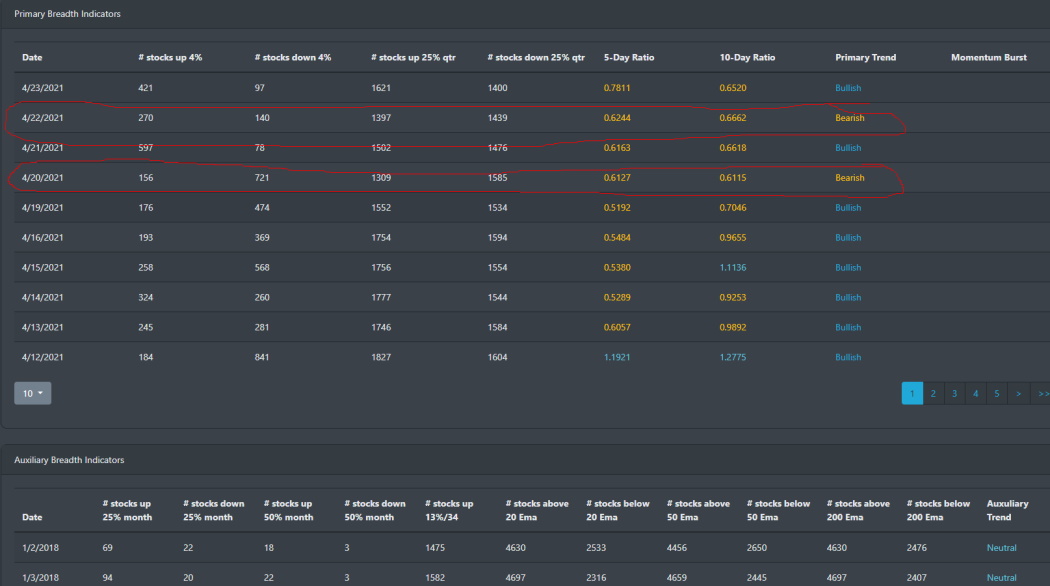
Market Breadth Table
Markets are still in a consolidation phase. Looking at the market breadth table, we can see markets climb higher into mid-April. On 4/16, the S&P 500 hit a high of over 4190. From there, markets have started consolidating near the 4150 price point. We can see that on Thursday, there was a minor reversal in the 5-day to the 10-day ratio which was followed by another bullish reversal on Friday 4/23.
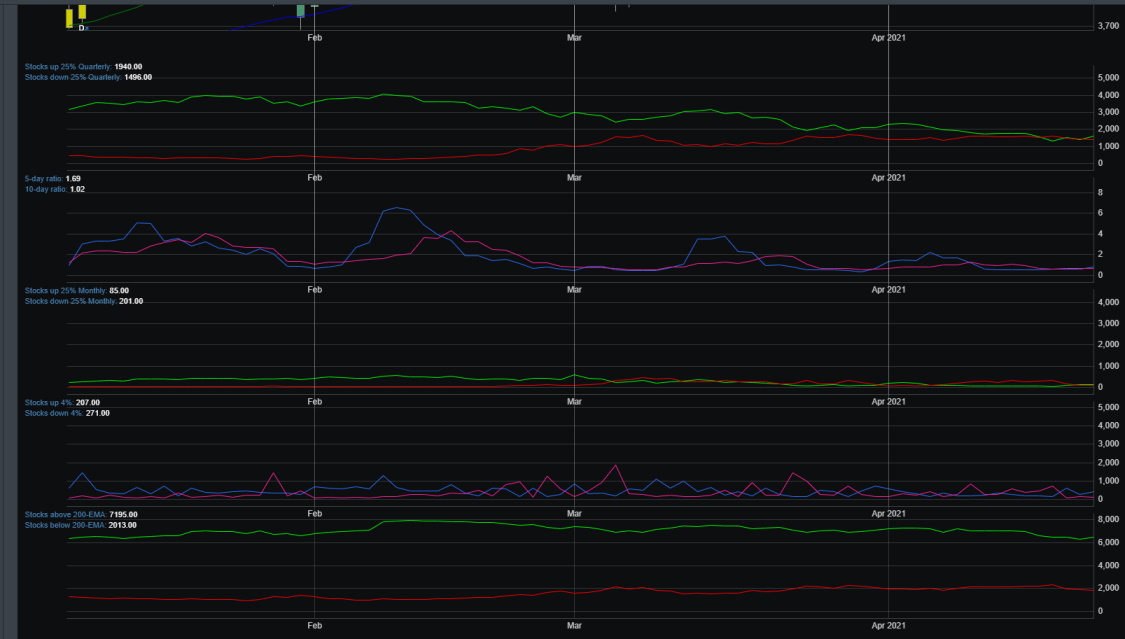
Market Breadth Chart
Overall, there is a lot of underlying strength in the equity marketplace. Starting in late November, 85% of stocks are still above their 200 EMA. The market strength has been broad for the entire year.
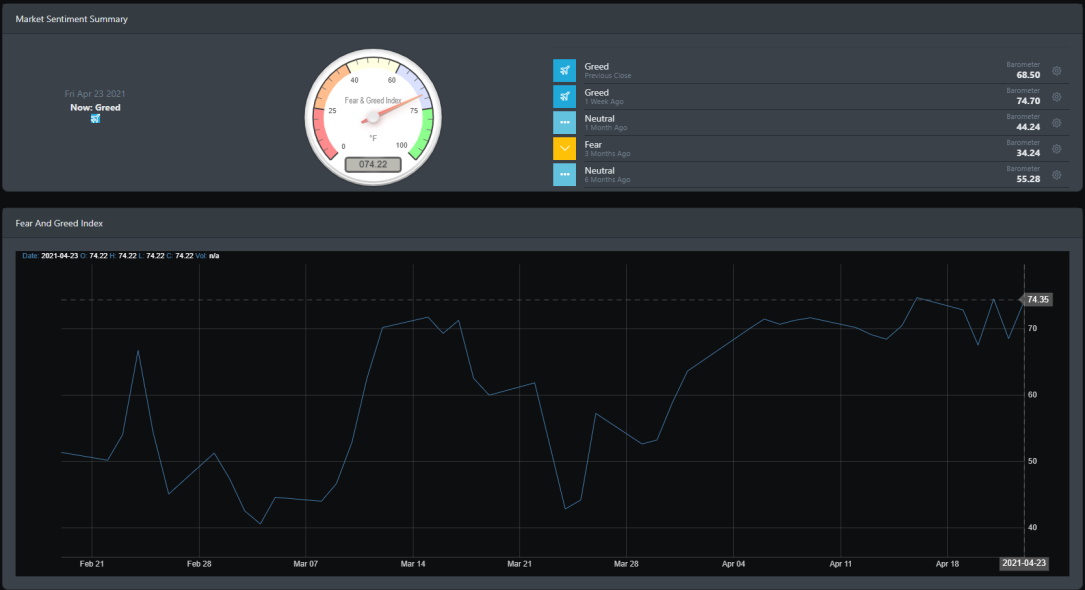
Market Sentiment
Market sentiment reading has been outright bullish. The index has been ranging in the 70s for most of April. The current AAI Sentiment shows the bulls outnumbering the bears by the most since January of 2018. Historically when our market sentiment index hits above 65, there is a high probability that markets dip in the ensuing few days or weeks. With the strong market breadth and solid earning reports for April, it seems that markets are all in.
Economic Outlook
With the Fed policy meeting slated for this week, it seems market participants are already looking ahead to a strong economic recovery. U.S economic data is showing strong improvements and the bonds market has calmed as of late. The 10-year Treasury yield is drifting near the 1.5% region. It is highly likely that the Fed stays the course and stick with current policy support.
Long leading
Unemployment claims fell for the 2nd straight week to 547,000. 2 weeks ago it was sitting at around 742,000. Continued claims though are still rising and are sitting at around 17 million. With Federal support programs set to end in September, we still have a ways to go to see improvements in the overall job recovery.
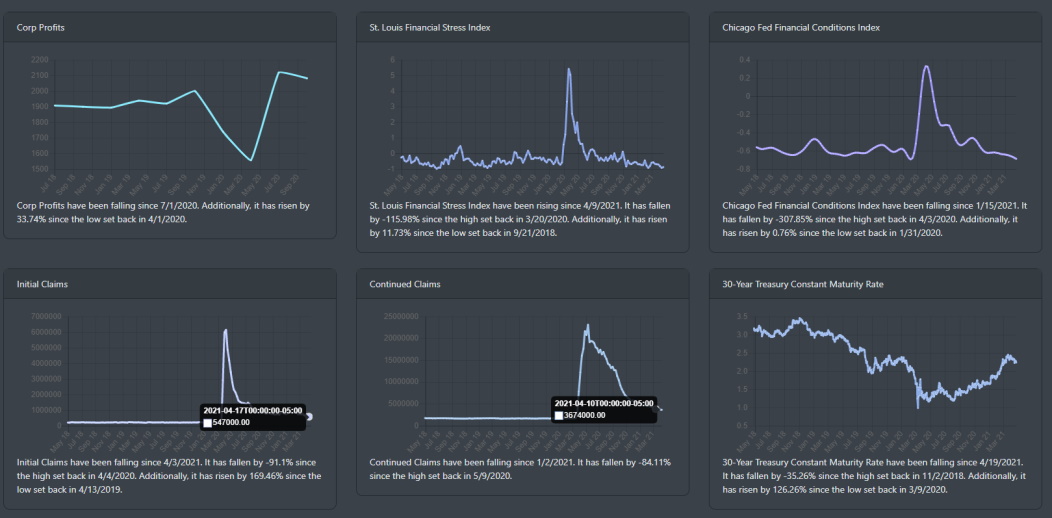
Leading
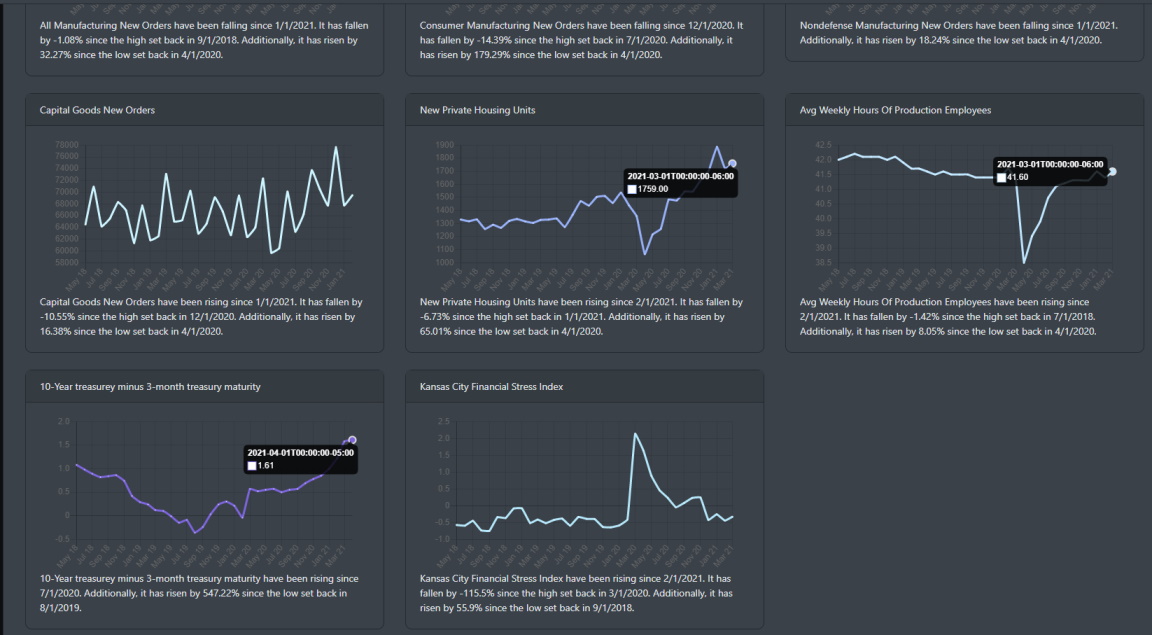
New home sales surged above +20% in March to a seasonally adjusted rate of around 1 million. The housing market is on fire and has not seen sales of this pace since 2006.
Market Outlook
Gains for this week are modest at best. Mid-caps leads the pack this week with a gain of only .95%. Overall, Small caps pushed higher to close the week while the larger caps index was down modestly. Three key components for SPY and QQQ were down: Technology, consumer discretionary, and communication. Today, we will take a look at the weekly timeframe to see what the major trend can tell us.
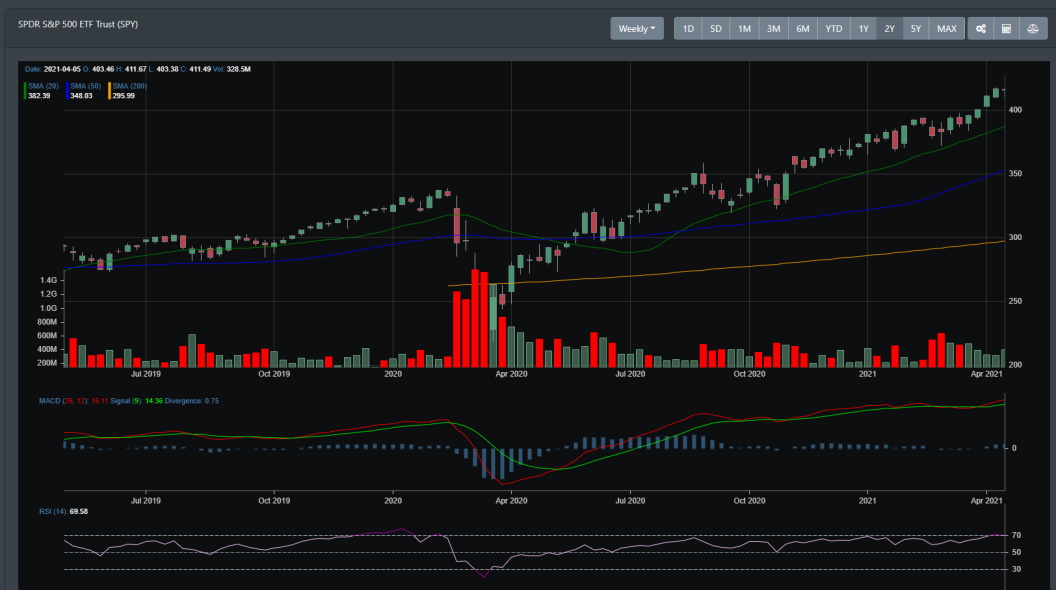
SPY
SPY is in a strong uptrend. It has been in the strong rally since the March lows in 2020. It has now rallied to +92% from the March low. There has been an uptick in April's volume as well.
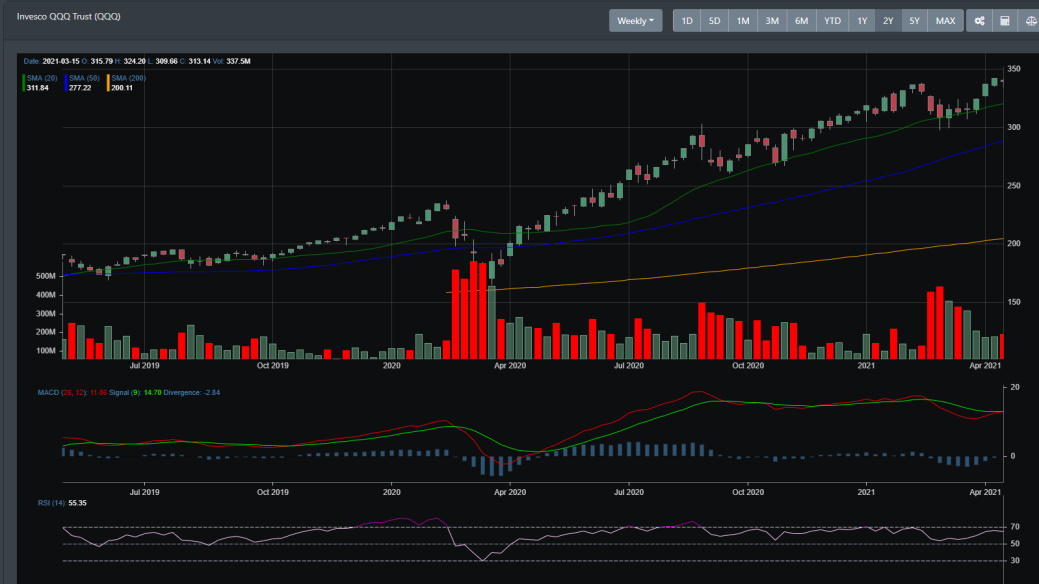
QQQ
QQQ broke the trend last month and found support on the 25 weekly DMA. It broke through resistance last week and is currently consolidating gains.
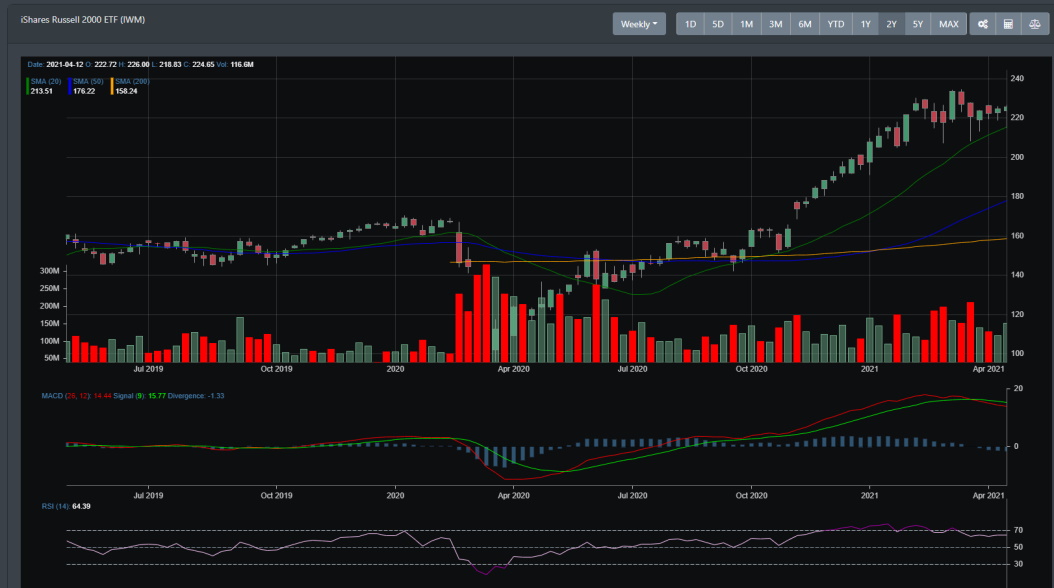
IWM
IWM has been in a strong uptrend since November. It also has rallied over +135% off the March 2020 lows. Right now, it looks to be trading sideways with the MACD in the sell signal.
Concluding
The strong economic data in Q1 is being reflected in the strong showing in Q1 earnings this month. With companies raising their forward earnings, it is looking to be a strong economic outlook for 2021. There is still plenty of pundits and news outlet calling for a major market correction. One example that some point to is the lagging Russell 2000 index. What they may fail to see is that the Russell 2000 is consolidating after a major rally from November 2020. This is also true for large caps as well.