A better and simpler approach to successful investing. Trend Finder tells you when to buy, what to buy, and when to sell. Built by Traders for Traders.
Trend Finder is so easy to use and follow, it requires only 3 steps:
- Login into our online trading tool, MogulUp, and review the list of stock and ETFs that are currently being signaled as a strong trend.
- Using our trend score for each security and the daily, weekly, or monthly buy and sell signals, execute your order.
- Hold your position until you receive the next daily, weekly, or monthly buy, sell, or short from Step 1.
From there, you just repeat Step 1.
To be a successful trader, you need the right tools to help you diagnose market conditions for any underlying stock or ETF. Trend Finder takes the guesswork out of identifying the uptrend and\or downtrend at any moment in time. Our proprietary software gives you the edge to profit within the trend of the market.
Below is a table of the Buy(Bullish) and Sell(Bearish) signals that are provided to you for any stock or ETF. When TrendFinder identifies a bullish daily trend, it will signal this in the charts and on the scanner for the day. Likewise, any weekly or monthly signal will also be placed on the chart and scanner for any particular set of stocks. This allows you to see which stocks are trending for the near-term, intermediate-term, or long-term.
| Signal | Icon | Description |
| Daily Buy |  | Bullish trends identified on the daily and intra-day charts. This signal is normally within the confines of the weekly and\or monthly signal. |
| Daily Sell |  | Bearish trend identified on the daily and intra-day chart. This signal is normally within the confines of the weekly and\or monthly signal. |
| Weekly Buy |  | Bearish trend identified on the weekly chart and technical time frame. This signal is normally within the confines of a monthly signal. |
| Weekly Sell |  | Bearish trend identified on the weekly chart and technical time frame. This signal is normally within the confines of a monthly signal. |
| Monthly Buy |  | Bearish trend identified on the monthly chart and technical time frame. This signal identifies a longer-term bullish trend for the underlying security. |
| Monthly Sell |  | Bearish trend identified on the monthly chart and technical time frame. This signal identifies a longer-term bearish trend for the underlying security. |
Join now and as a subscriber to Trend Finder, you will get direct access to our world-class BullGap software platform, MogulUp.
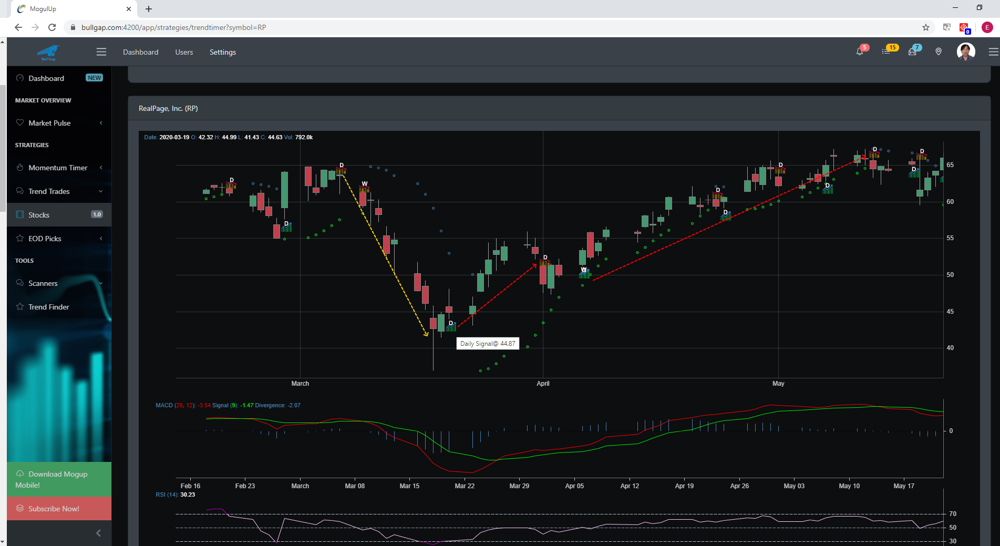
Below is a screenshot of TrendFinder. TrendFinder has analyzed RealPage (RP symbol) and you can see the trades where it has identified the trend in the market. The dash yellow arrow shows where you could have shorted RP and made a substantial profit. Likewise, the red-dash arrow shows where the buy signals would have gave you an incredible ROI.
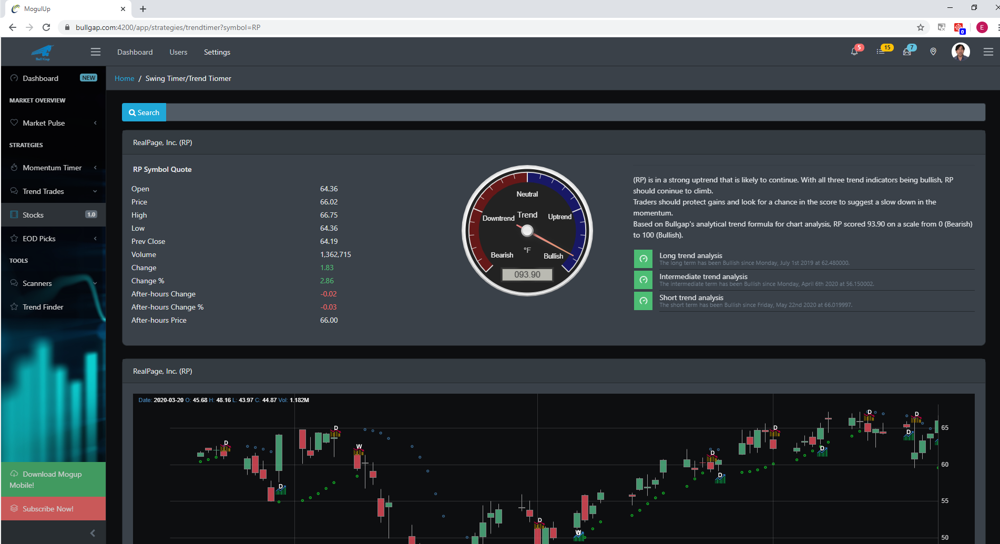
Below is a dashboard for TrendFinder. Here we are analyzing RealPage (RP). TrendFinder gives you a "Rating" score for each stock and ETF that helps you gauge the strength of the trend. Trends are identified by short-term, intermediate-term, and long-term. When all three indicators are bullish, you can ride the uptrend for that particular stock or ETF. Conversely, you can ride a downtrend by shorting the stock or ETF.
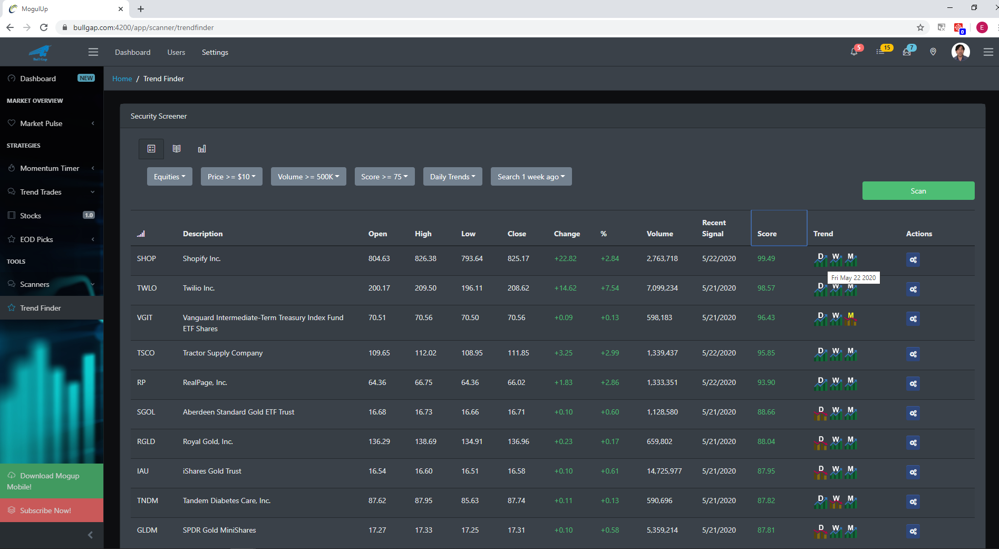
Powerful scanner tool that gives you visibility into 1000s of stocks and ETFs that we scan on an intraday level. You can apply filters for price, volume, our stock score rating, and much more. Additionally, you can use our predefined scanners that provide custom scan tools that help you identify trends for highest highs, lows, 1 to 4-week highs and lows, strong momentum, etc. And even you want to trade with technical indicators, we provide signals for Macd crossover, stochastic, etc.
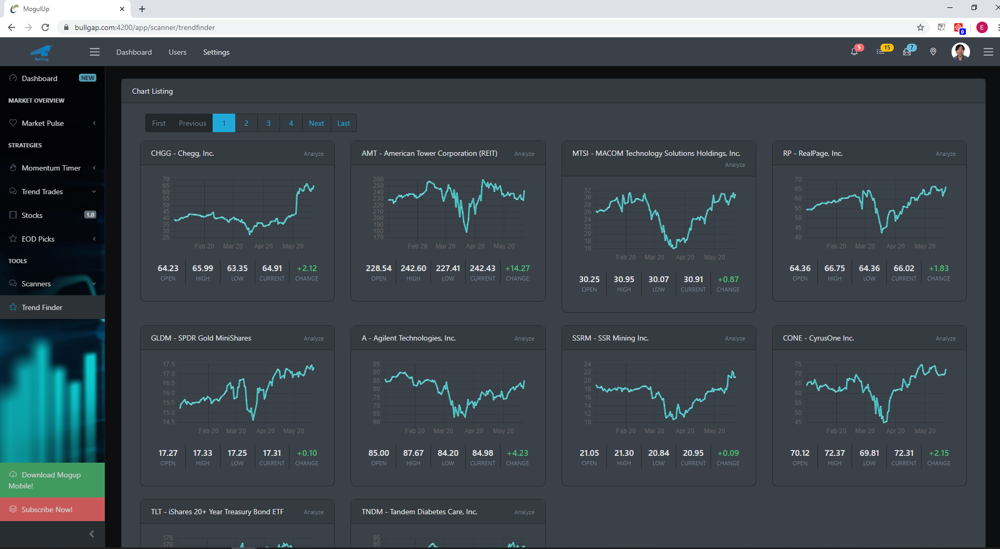
Below is a screenshot of our accompanying chat view for every scan that you make. You can easily navigate to Trend Finder analysis with a click of a button.
Want to learn more about the Trend Finder in detail? Click here for a more detailed discussion of the BullGap's TrendFinder.


