


Extreme euphoria and excessive speculation have been driving the market as of late. The major market indices are trading at all-time highs. Even with the recent volatility, markets are still in a major uptrend. With continued support from the Feds and Biden's recent callout for a stimulus package, investors are trying to thread the needle with the expectation of a strong recovery ahead. As discussed many times over in our prior blogs, the financial market continues to be driven-by ample liquidity introduced by the Feds. With the Feds making it clear last week that they do not plan on raising rates at anytime (and in our view probably for the foreseeable future) and Biden unleashing his plans for $1.9 trillion dollar initial stimulus bills to support the economy and the vaccine rollout, investors are all ante up.
Big Picture
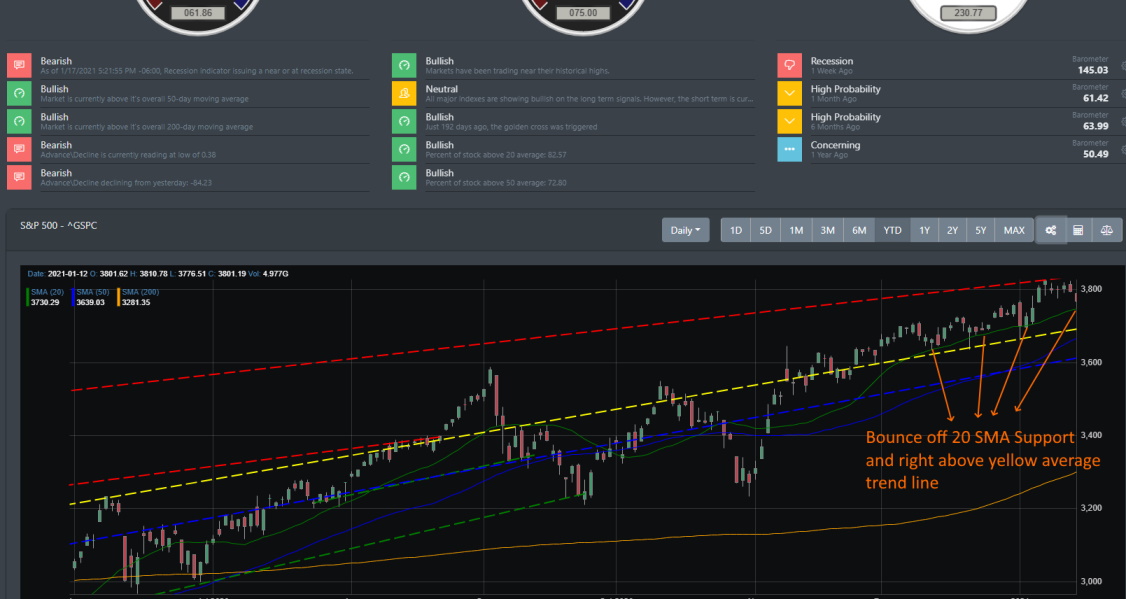
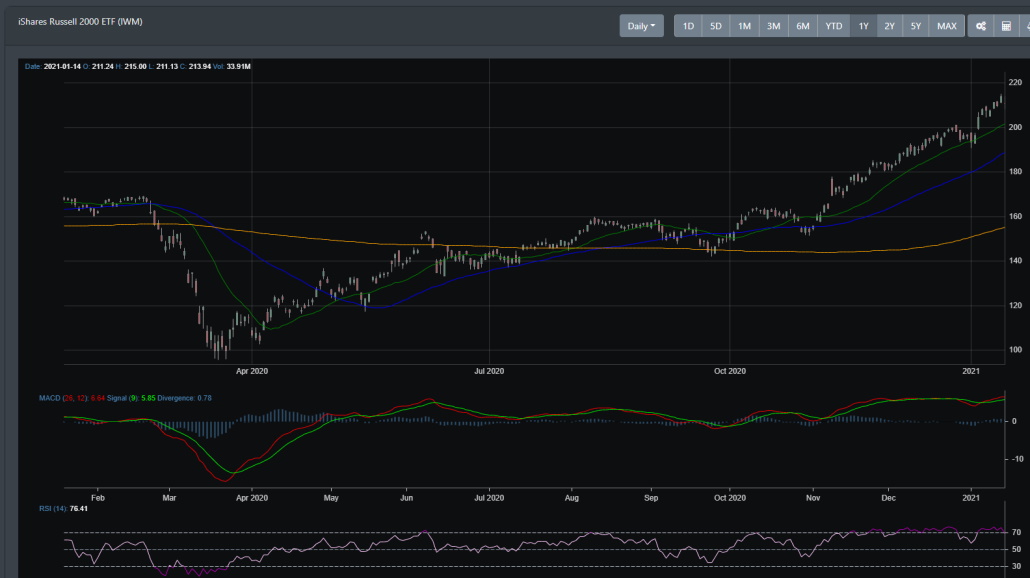
It was a down week for the market with the S&P 500 closing the week below 1.5% with a trading range of around 2 percent. Looking at the chart below, we can see that the market closed on Friday right above the 20 DMA support line. Looking at the past month and a half, you can see that on 4 previous occasions the market tested the 20 DMA. On each of those occasions, it bounced back and never fell below the average (yellow dash line) trend line identified by BullGap's trend finding algorithm.
Market Breadth
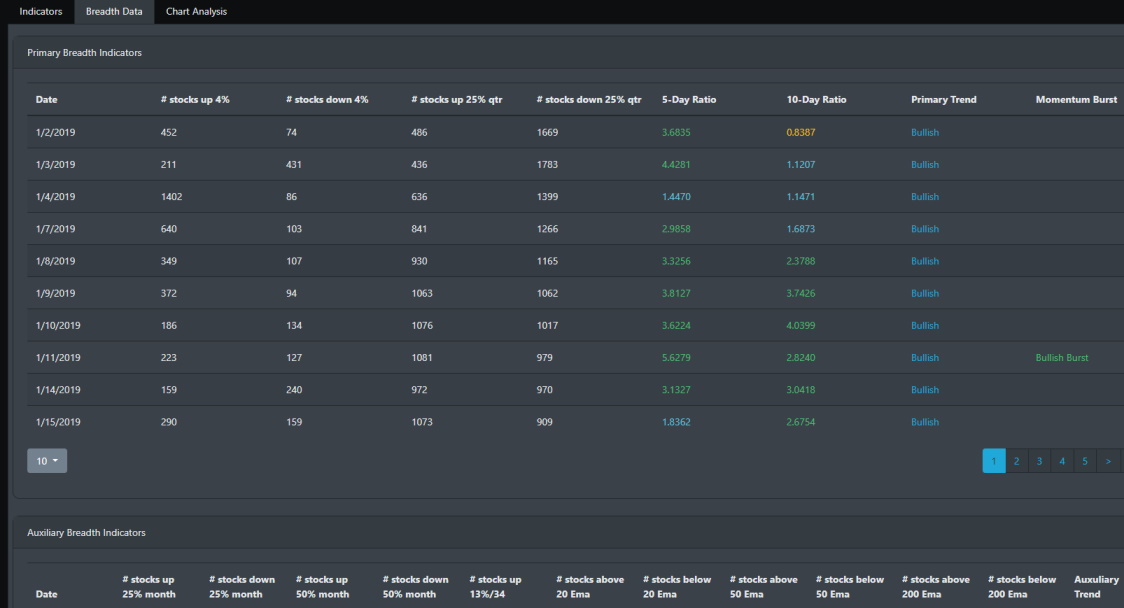
Just by looking at the near term for last week, we can see the short term sell-off occur right on Friday. On 1/14, stocks that were trending above 4% were at 725 and the ratio momentum was still strong. On Friday 1/15, the market sold off and you can see the near-term drop to 189.
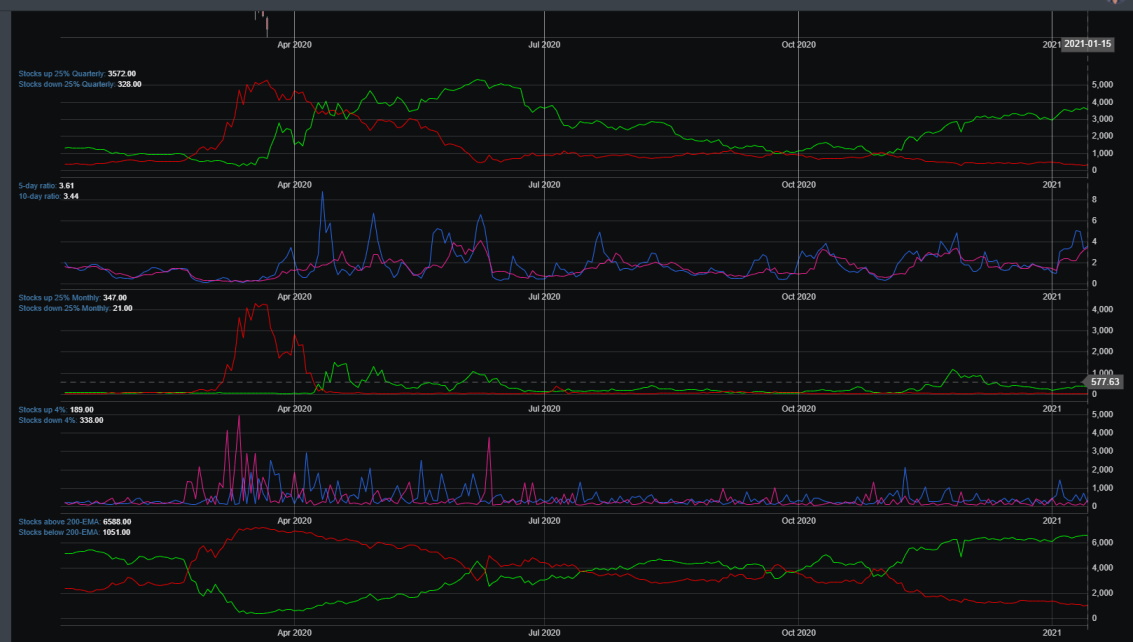
We are still seeing a historically large number of stocks participating in this market rally. Since mid-November of 2020, investors have been riding high and have pushed more than 80% of stocks above their 200 EMA.
Market Sentiment
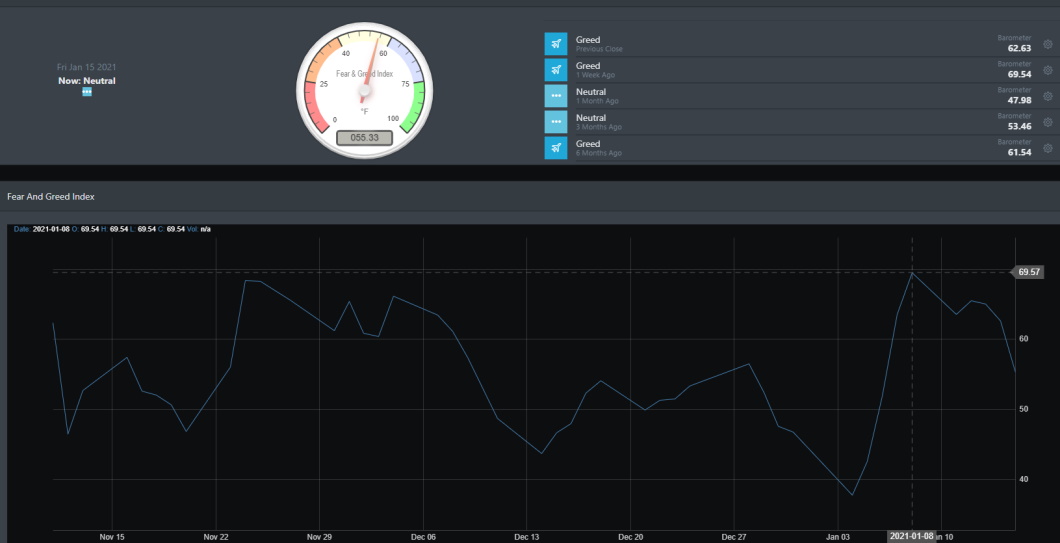
For the past couple of months, we have noted the exuberance in the market. Since hitting a high of 69.54 on 1/8, market sentiment has moved to neutral. With the early optimism of President-elect Joe Biden's stimulus plan that helps propel the markets in late to early January, it seems markets are weighing in on the current development in the weak jobs data and the slow economic recovery.
Economic Outlook
Recent news for last week was the surge in the Initial claims for unemployment benefits. With the prior week reading 787,000, the initial claims moved up to 965,000 in a one-week time span. After hitting a peak of 6.9 million back in March 2020, initial claims have been ranging between 700,000 to 1 million for the past 20 consecutive weeks. Continuing claims readings rose from their last reading back in 12/26/20 to 5,271,000. Because of a surge in covid cases, there has been a renewal in government restrictions which is posing a significant threat to the economic recovery.
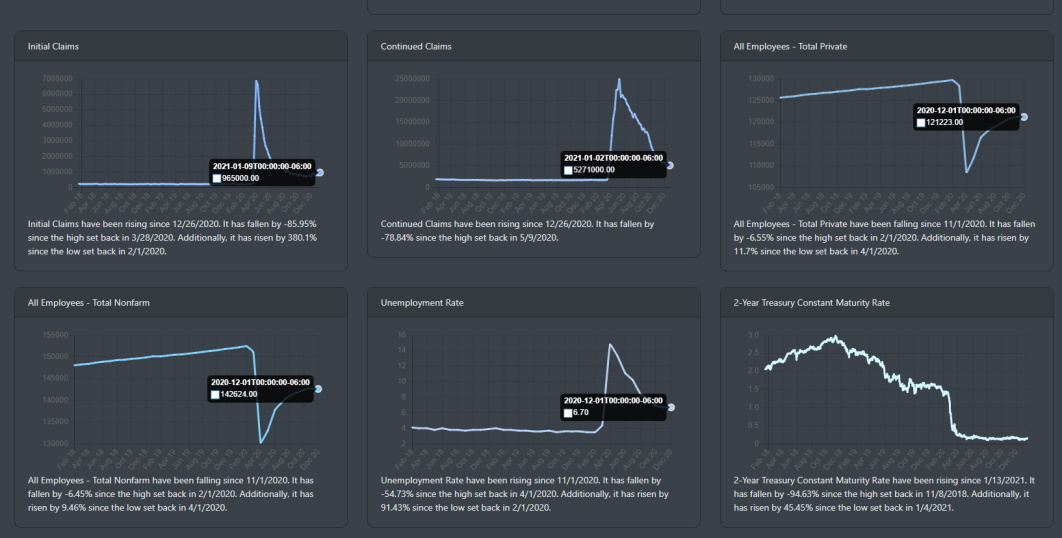
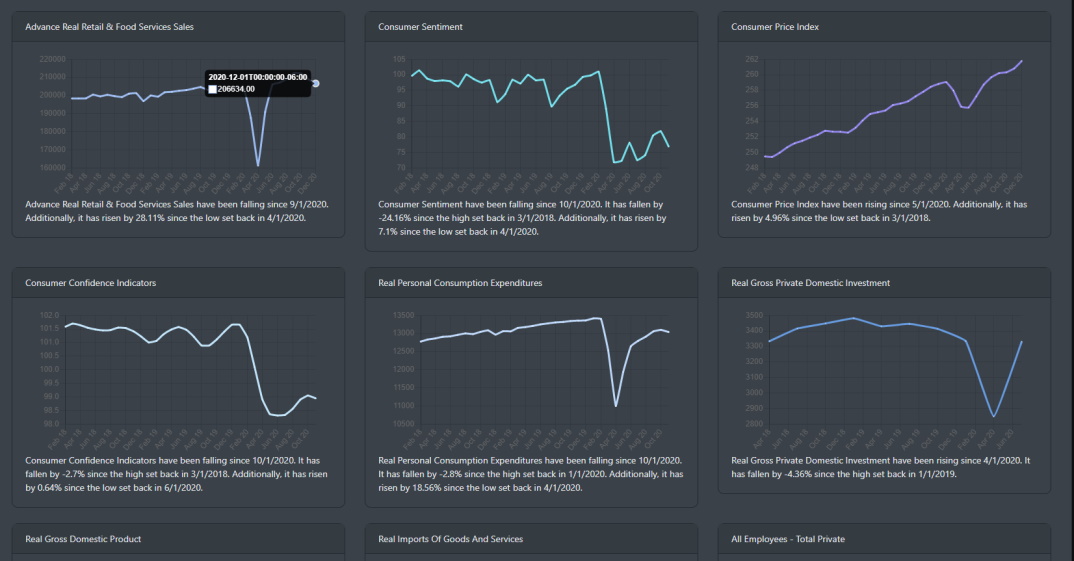
Another alarming data that is cropping up is Retail sales data. For the past 3 consecutive months, Retail sales have been on a decline.
Market Outlook
Market performance this week has been split this week. Small caps were up to while the technology QQQ was down. The treasury market was modestly higher this week. For the past few days of last week, volatility enters the market. SPY and IWM were trading in a very narrow range but has since widened from 2 basis points to more than 7 points.
Concluding
Technically for the markets, Daily chart readings were bullish last week and are still trending upward. With recent volatility, some of the momenta has dropped but money is still flowing into the market. And as we discussed in our market breadth reading, a majority of stocks are trading above their 50 EMA and 200 EMA.