The winning streak continues for the market. While volume has been low, activity and FOMO is anything but that. For the past month, markets are on an uptrend with new all-time highs being hit in recent days. The equity market has recovered in just 6 months after crashing by over 35% during the March lows. SPY and DIA dropped 30+% in March relative to early 2020 highs. Nasdaq dropped 20%. Now, all major indexes are in the positive for the year. The S&P 500 is now up 15% year-to-date. The big winner for the year is the Nasdaq (QQQ) with a whopping 50% rise year-to-date.
With ample liquidity in the market and interest rates at record lows, the global equity market has made a strong recovery for the year. For perspective, the last crash in 2008 required over 5 years for the S&P 500 to regain its previous highs.
Big Picture
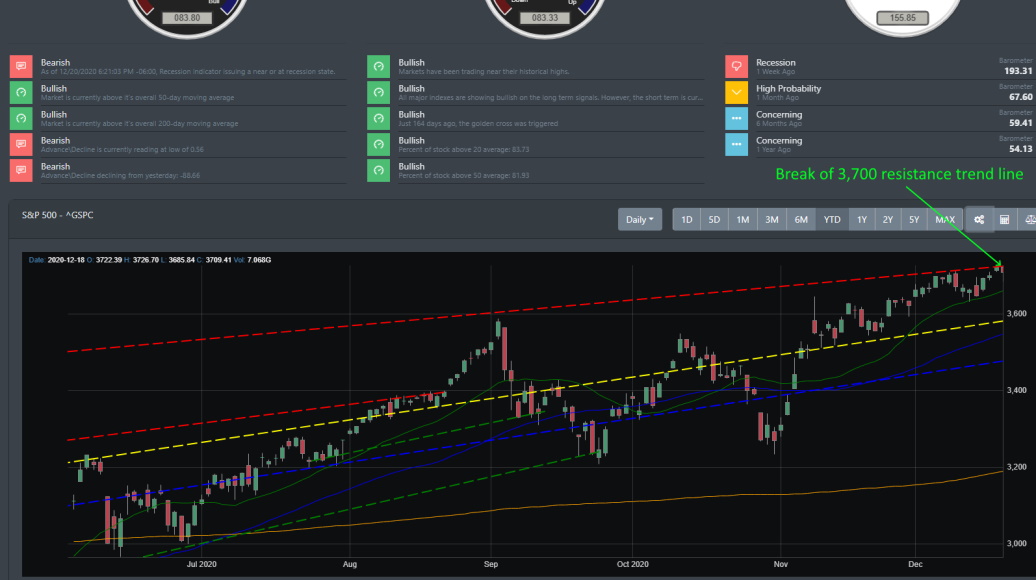
In the last couple of blogs, we discussed how the market is looking to encroach 3800 to 4000 by year-end. Well, last week, the market broke right through to the 3,700 resistance. The door is opened now for a potential move up to the 3900 range and give bulls their "Santa Claus" rally for December 2020.
Market Breadth
Last week on Wednesday 12/16, Bullgap's market breadth metrics read signal another Bullish movement to the upside. Since that trigger, the markets propel and pushed above its resistance of 3700.
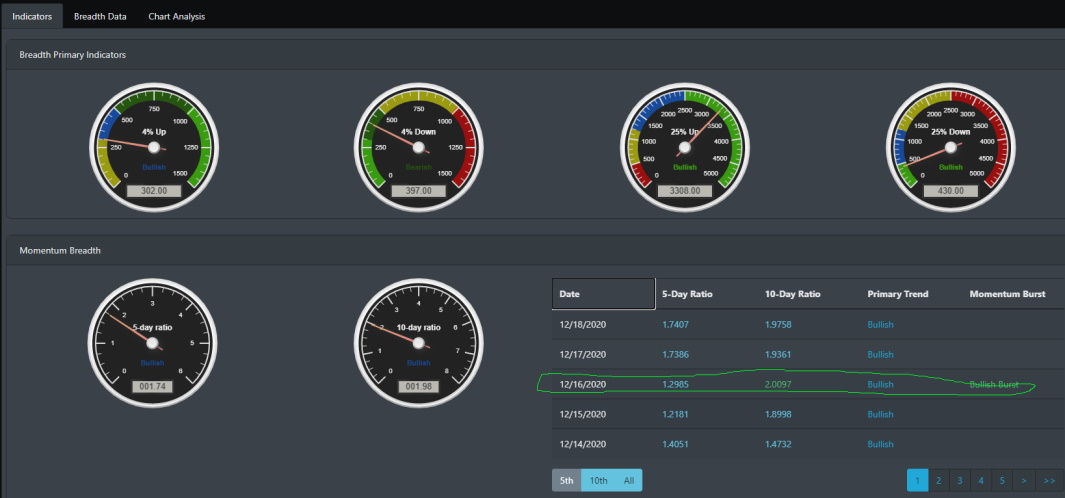
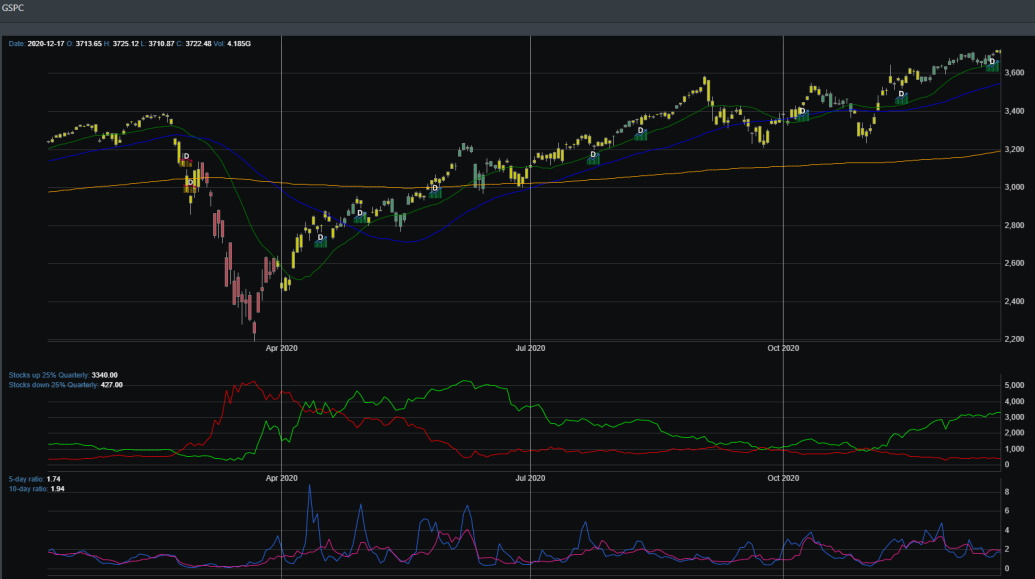
As noted in our prior blogs, the market is on an unprecedented run. More than 80% of the market is trading above their 200 DMA with a large percentage of stocks up 25% in the quarterly reading.
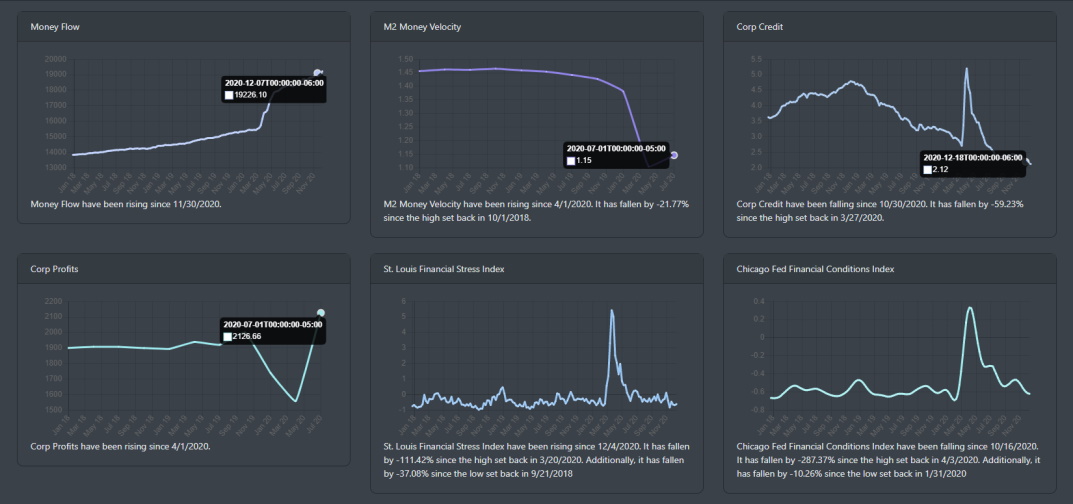
Economic Data
The chart for our long leading indicators pretty much sums up the credit market. Liquidity is ample and credit is dirt cheap. Also, corporate credit has made more than recovered since hitting the lows in the May timeline.
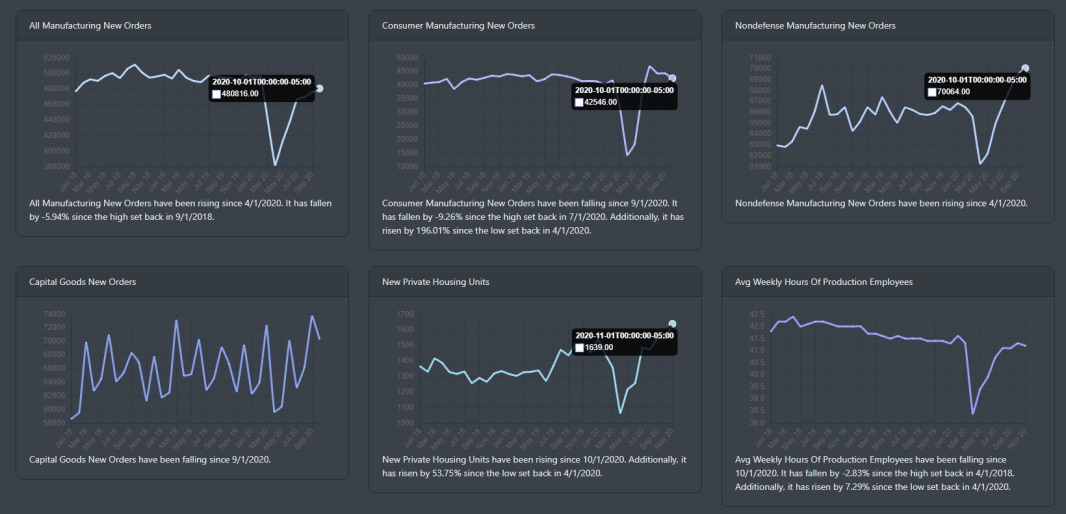
In our leading indicators, we can see that consumer durables declined for the past couple of months. However, they have surged past their pre-lockdown levels. Nondefense manufacturing continues to surge upward. Average weekly hours for production employees have already recovered from pre-lockdown levels.
Market Outlook
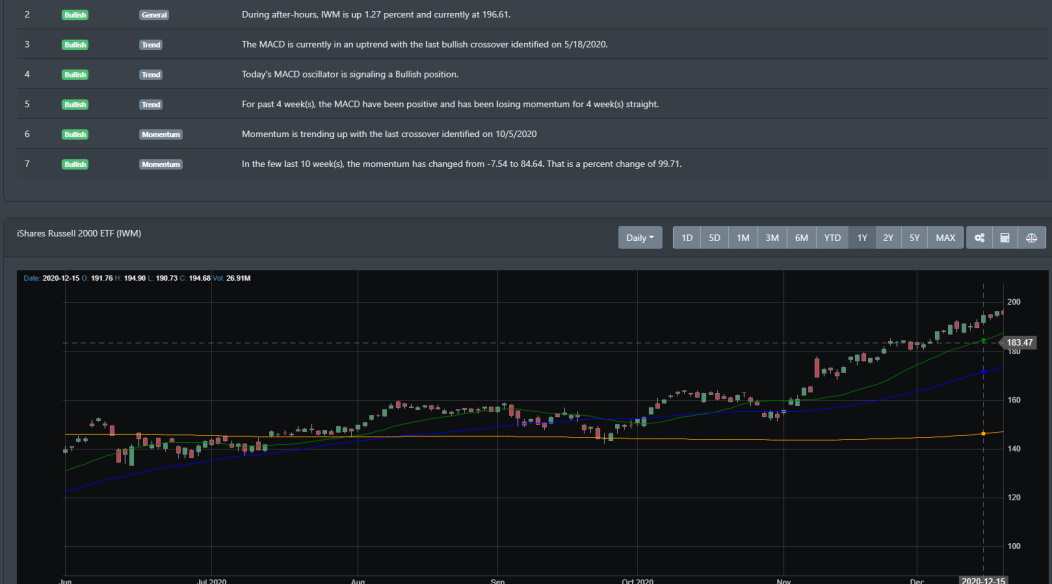
IWM small caps are on a roll for this month. For this week alone, small caps are up 3%. Both SPY and QQQ were also top performers for the week.
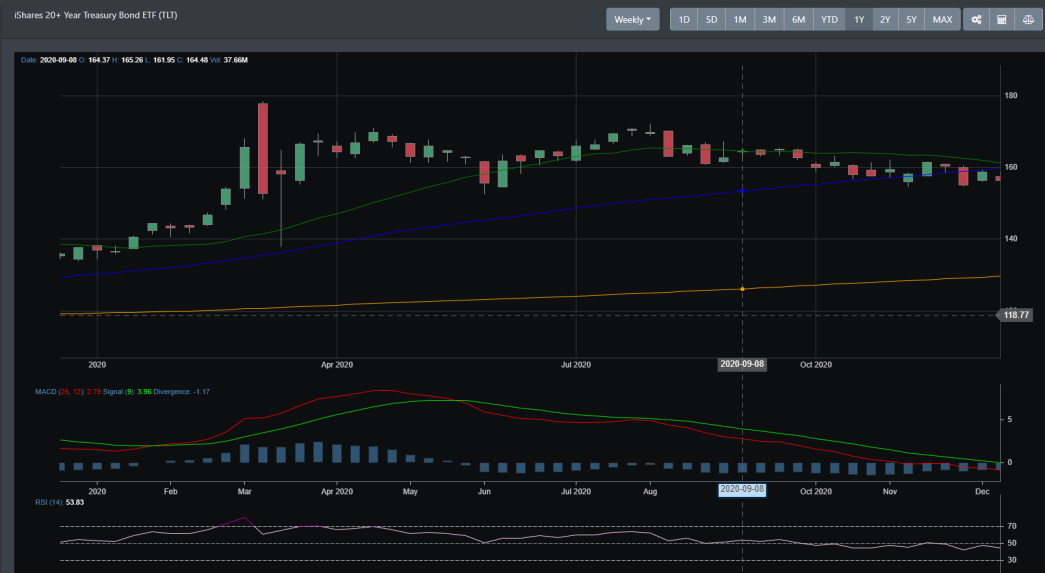
The treasury market (TLT) dropped this week and the weekly trend is reading bearish.
Concluding
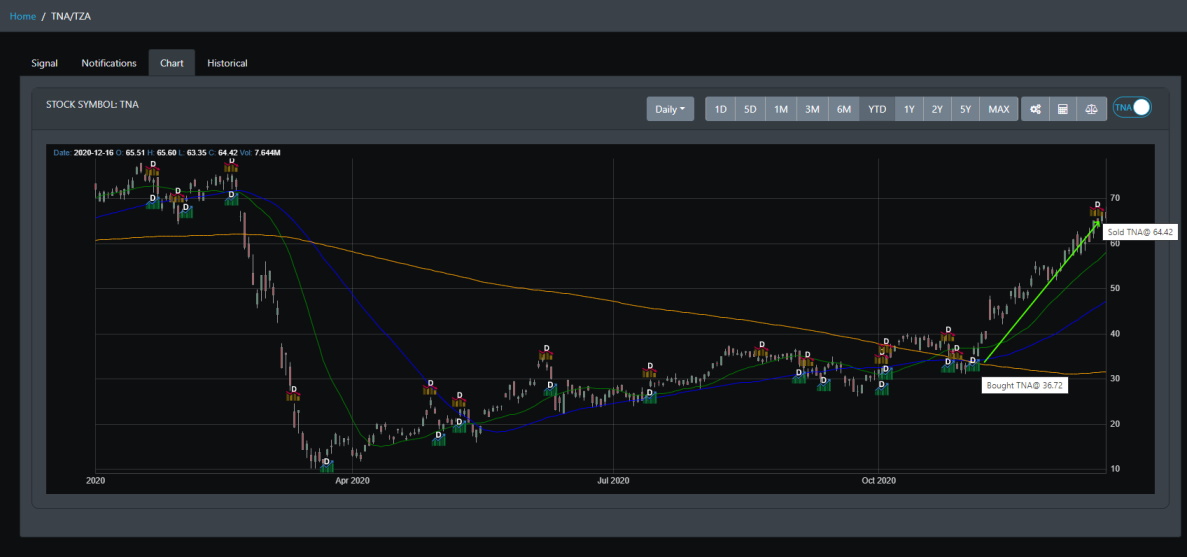
The bullish uptrend continues. With the rollout of the vaccine and Congress trying to push a COVID relief bill that includes stimulus checks, the "Santa Claus" rally is looking more like a possibility. There is a good probability that markets will move up before year's end, we could see the S&P 500 test 3,900. However, as we discussed in recent blogs, the markets are stretch and BullGap's Momentum Market Timer has issued a sell signal last week on Wednesday 11/16. The MMT algorithm also issued a sell signal on February 20, 2020 right before the market crashed. Below is the gorgeous run on IWM small cap using TNA as the trading vehicle. So, what does this mean? Historically, when the MMT system triggers a sell signal, a correction occurs within a week of the trigger.