


Markets are currently showing a near-term overbought signal. This short-term sell "signal" was triggered last week by BullGap's Momentum Market Timer. Even with the current momentum signal issuing a sell, investors need to be mindful that this is really nothing more than the markets alleviating some of the overbought condition that is currently in the equity market. The current Bull Market that was started back in 2009 is still intact. With all the negative noise suggesting a market-topping and a "runaway" inflation that will pull down the entire market, one would wonder how anyone would believe what is currently happening in the market.
What is happening in the market as of now? Well, if the equity market ended today, the S&P 500 would have already made over 38 new highs as of the close of Friday 7/16/2021. Markets making highs after highs are what one would consider a very strong bull market. But if you have been reading all the market experts claiming that the market is overdue and ready for a major correction, you would have lost on the profitable gains made since the March low back in 2020. Better yet, all the gains starting in 2009.
Big Picture
The week started off with the S&P 500, Nasdaq, and Dow 30 all posting new highs on Monday. If you were in the camp calling for a market bubble or inflation stock market bust, you would have been wrong 38 times this year. As we discussed earlier, BullGap's Market Momentum Timer signal earlier last week that momentum was turning bearish. This signal proved correct as the technical readings started turning bearish on the weekly and daily charts. All major indexes lost this week. Both the S&P 500 and Dow Industrial fell less than 1% while the Nasdaq Composite lost over 2%. The Russell 2000 which has been in trading sideways since February this year dropped over 5%.
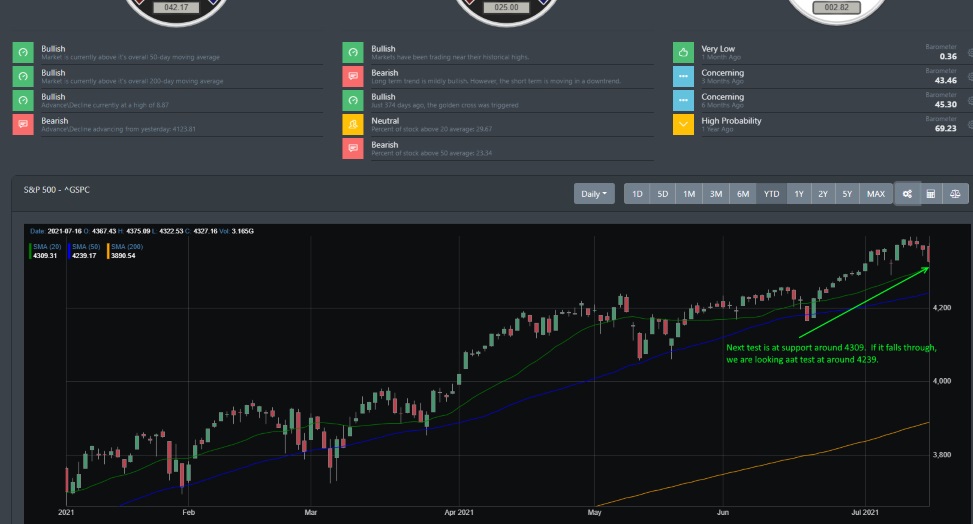
Looking at the Big Picture image below, we are expecting the market's next test to be around the 4309 marks (20 DMA). If the market holds at this point, we expect the market to push onward to our projected region of 4400-4500. If support breaks, then we expect the next support line will be tested near 4239.
Market Breadth Table
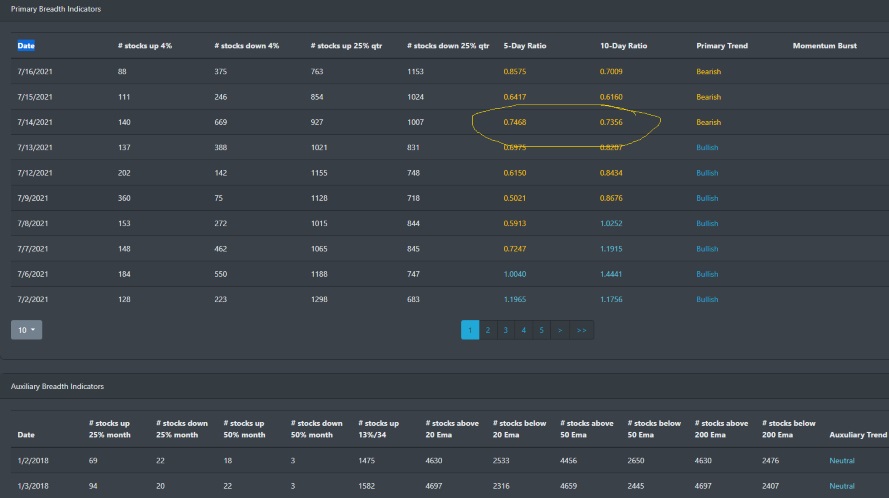
Market breadth is normalizing after kicking off near the end of May this year. Stocks trading above their 200 DMA did drop down to the lowest point for the year.
Market Breadth Chart
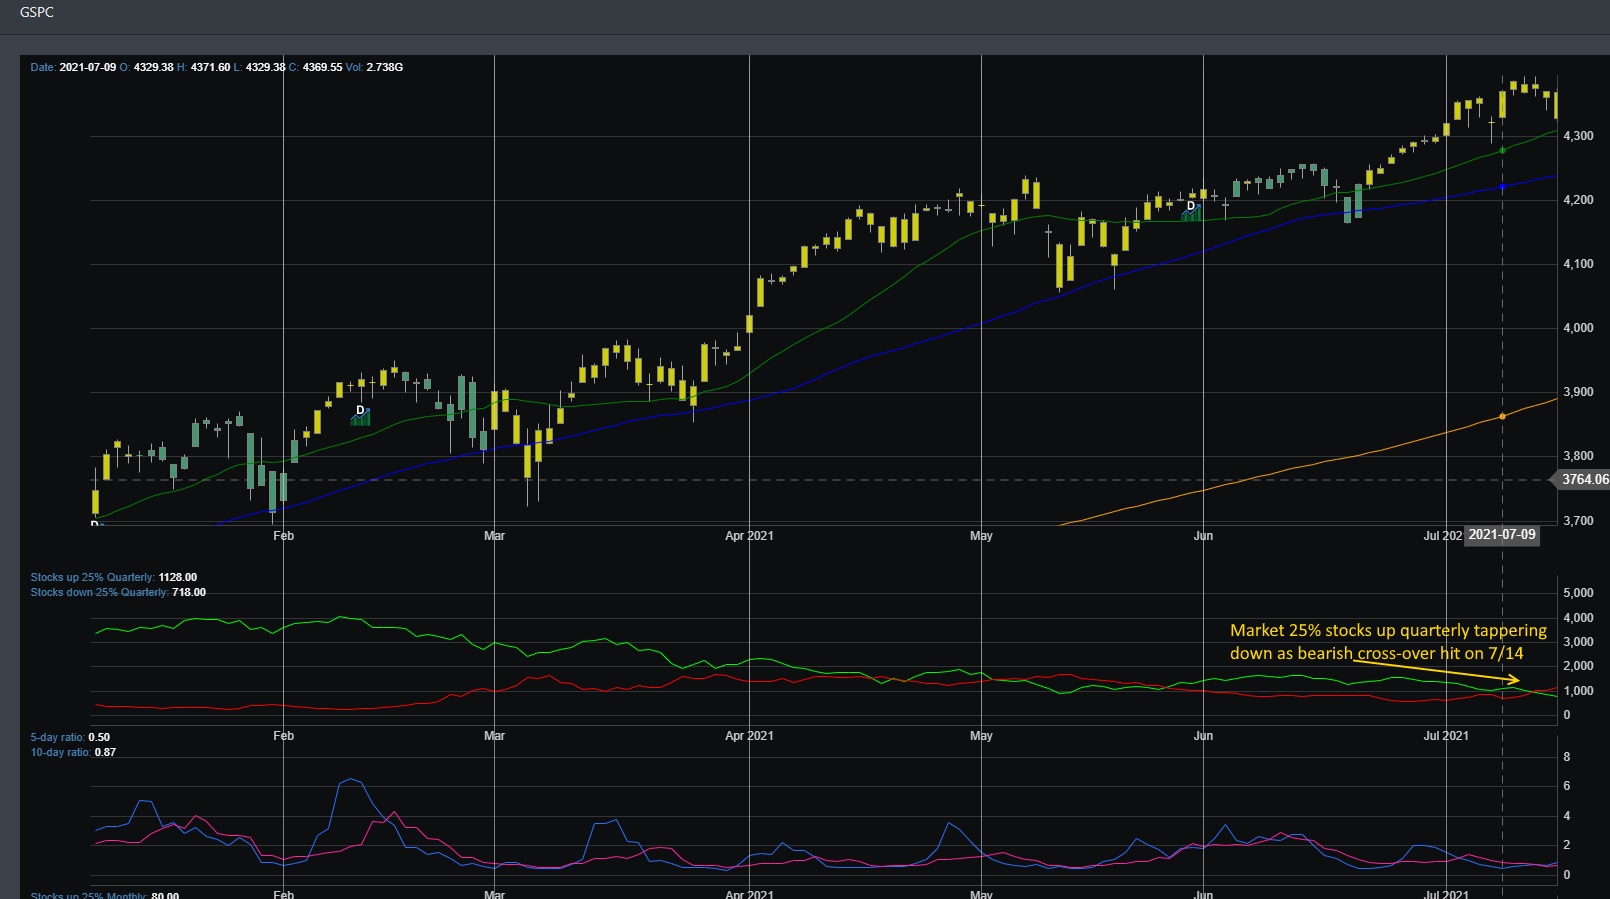
After hitting a bullish momentum signal during late May, markets have rallied to all-time highs. With technicals reading in the overbought region, we are now seeing a near-term topping in the market. Stocks up 25% quarterly have been tapering down as markets move higher. This week on Wednesday 7/14, the bearish cross-over hit signaling a bearish move to the downside. Market breadth is showing some near-term weakness but overall market breadth is still strong.
Market Sentiment
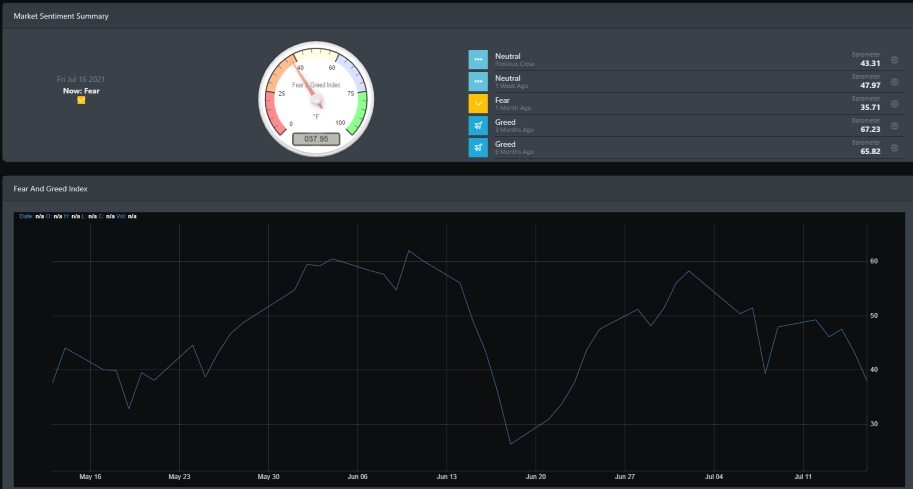
BullGap's market sentiment hit the fear reading this week as markets turned bearish during mid-week. Coming from a high back in late June, sentiment is now swinging back into the fear reading.
Economic Outlook
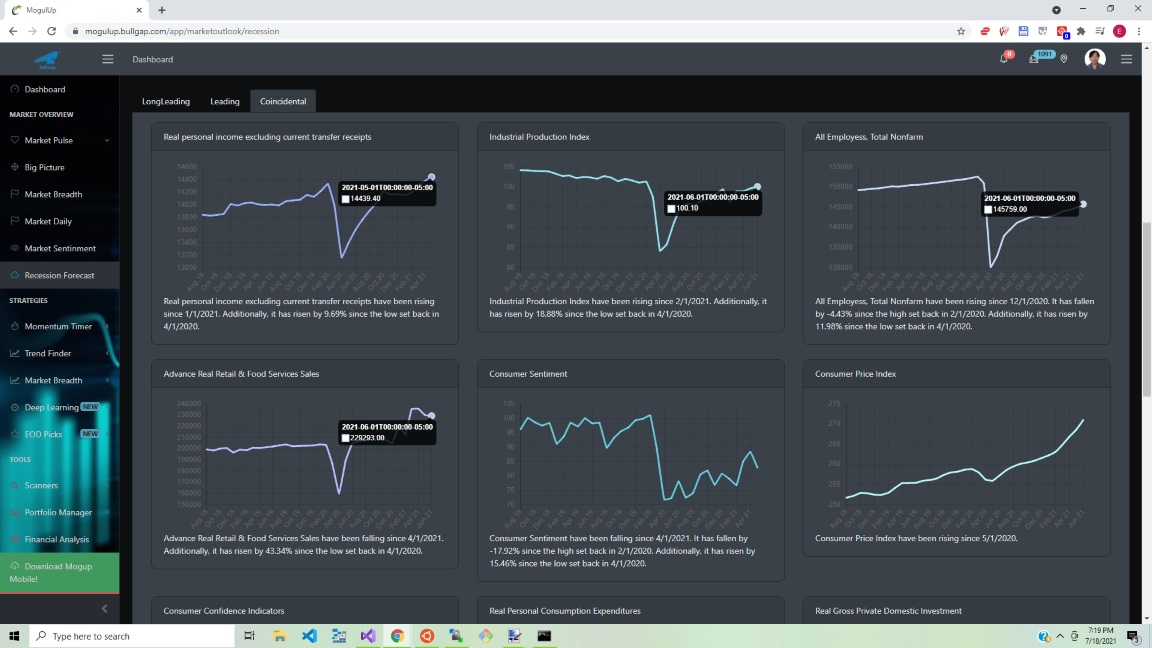
The economic picture is still positive. The Consumer Price Index increased by 0.9 percent in June and has been increasing since the beginning of this year. On a 12-month basis, this pace is over 5% year over year. This jump in price though has not steered away consumers from spending as we can see the Advanced Real Retail and Food services well over pre-pandemic levels. Additionally, real personal income has increased while real personal consumption expenditures have risen for the year. All this means is that the "average" consumer is in much better shape than they were a year ago.
Market Outlook
Markets are currently in overbought condition and as a result, we are seeing the markets behave as they normally do in a bull market. They have minor pullbacks to dissipate the overextended conditions. While selling did occur this week, markets held support. And as we discussed a few blogs earlier, the last 6 market dips have only been less than 5 to 6%.
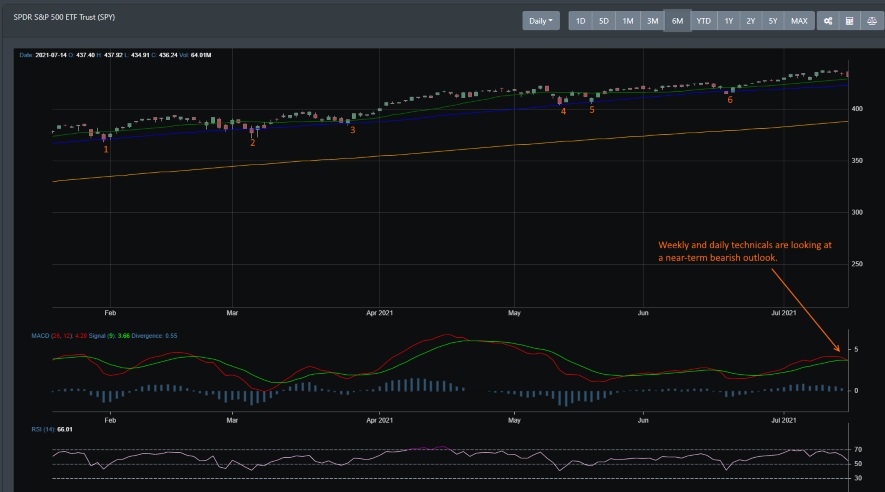
SPY
The image below has been labeled with numbers (1 to 6) where SPY took a market dip at the 50DMA support line. Each time the market dipped near the 50 DMA, it bounced off to new highs.
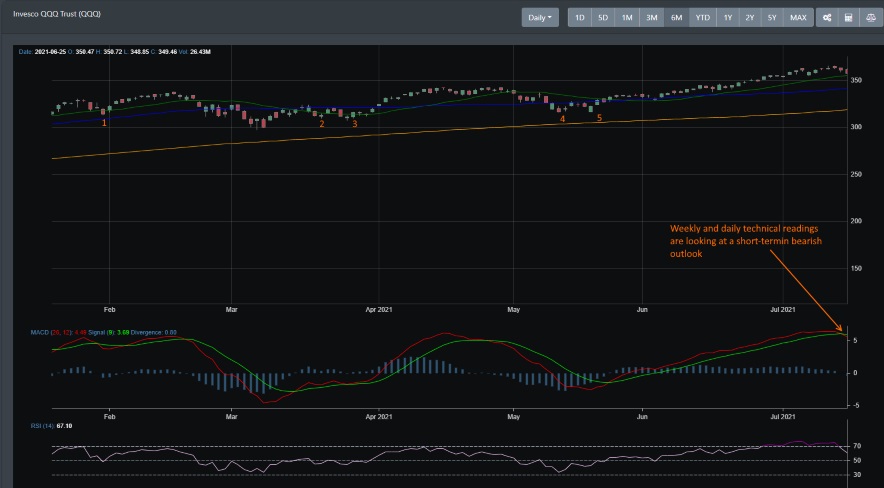
QQQ
QQQ also exhibits this behavior. Only during March was when QQQ dropped below is 50 DMA. QQQ and SPY have been in a solid uptrend since the end of May. It is now looking to work off the overbought conditions.
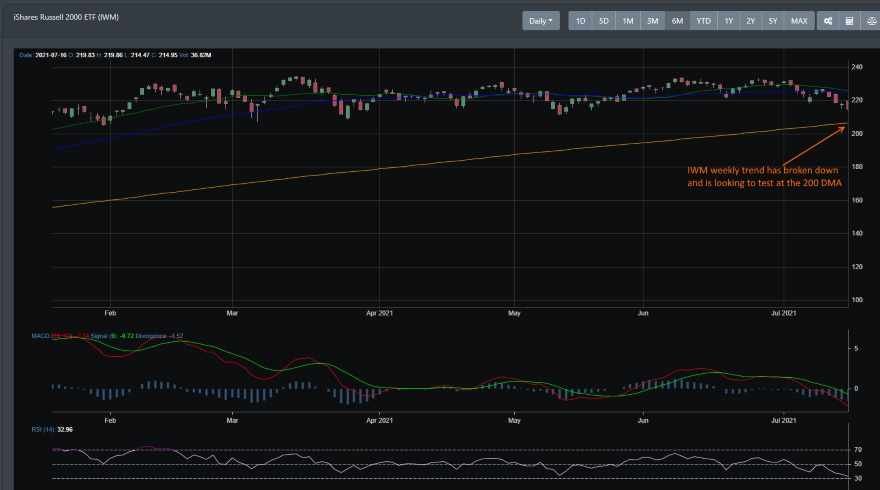
IWM
IWM is the outlier among the major index ETFs. IWM has underperformed SPY, QQQ, and DIA by a huge margin for the past few months. With last week's market performance, IWM dropped more than 5% for the week. While IWM did lead the market by the later part of 2020 and early 2021, it is now turning bearish on the weekly and daily charts. The next support line could be an IWM's 200 DMA.
Concluding
With most major indexes near all-time highs and with many market pundits forecasting a market bubble with inflation ready to drop the market, it is no wonder why so many investors right now are fearful or worried about what the next move is for their portfolio. Is inflation here to stay or is it transitory as what the Feds believe is the case with an economy running hot and with a supply shortage? Right now, there is no reason to justify inflation being entrenched for the long haul as shutting down an entire economy and trying to kick start it into high gear can cause inflation to run hot.
Markets right now are alleviating some of the steam from the recent late May rally.