


Support & Resistance
In forex trading, commodities, or securities, prices always move up and down. This happens because of supply and demand. But the increase (and decrease) in prices does not last forever. Sometimes the price stops at a point, and then reverses direction. To find out when price movements will stop and reverse direction, one of them is by using the analysis of Support & Resistance.
Support & Resistance is one of the techniques most often used in technical analysis. A trader is certainly obliged to master this technique in order to obtain optimal results, while minimizing losses. Is that right? Then, what exactly is Support & Resistance?
Support Meaning
Support is the price level at which demand is thought to be strong enough to prevent the price from declining further. Simply put, an area of support is where the price of an asset tends to stop falling. When touching a support level, prices seem to bounce back up. But if this support is successfully broken, the price will go down to find a new support level.
Support can also be interpreted as the "lower limit" which is likely to be impenetrable by a declining price movement. The support line is often used by traders to start buying securities, because it is estimated that the price will not go down again, and will rise after touching the line.
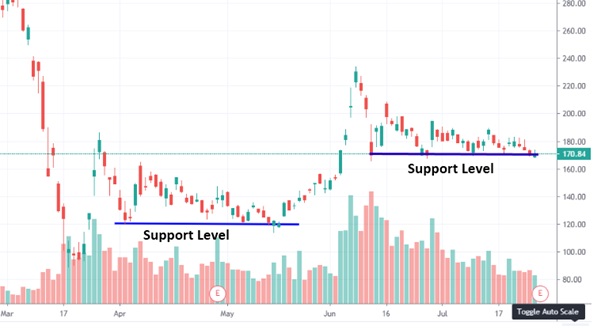
Support levels are usually below the current price. But where is the support level, each trader has a different opinion. As we know, technical analysis is not an exact science. The form does not have to be a line, some traders and investors establish a support zone.
Resistance Meaning
If Support is considered the "bottom" price of a security, then Resistance is the "upper limit". Resistance is the price level at which selling is thought to be strong enough to prevent the price from rising further. This level is used to determine whether price movements will continue or reverse direction.
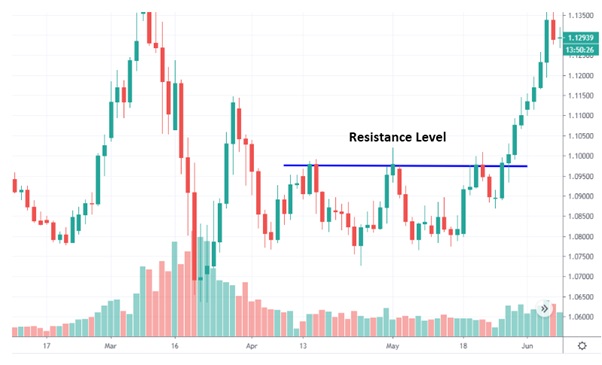
Economically, Resistance can be interpreted as a level where supply (selling action) is quite large, while demand has begun to decrease. As a result, market prices will tend to fall at that level. But if the price turns out to continue to rise and the resistance level can be broken, then the resistance level that has been broken will become support. The price will then move to find a new resistance point.
The resistance area is generally a reference for traders not to buy securities because the price is already considered expensive. In such conditions, traders start selling securities to take profits, so prices start to be depressed and come back down.
How to Determine Support and Resistance?
There are many opinions about how to determine the level of Support & Resistance. Every trader has different points of view and preferences. However, most traders agree that the level of Support & Resistance is not just a certain "line or point", but rather a certain "area". 
A good level of Support & Resistance should have been "tested" at least twice. So, not just once, but prices have at least twice bounced from a certain price range. Usually the more often a price level is touched and tested, the stronger the Support & Resistance level.
To determine the level of Support & Resistance, there are several ways you can do, which are as follows.
Manually Draw Lines
This is the simplest way to determine Support & Resistance levels. The steps are:
- Search history of price movements at a certain time.
- Look for the highs and lows of price movements.
- Draw a horizontal line at the highest and lowest points.
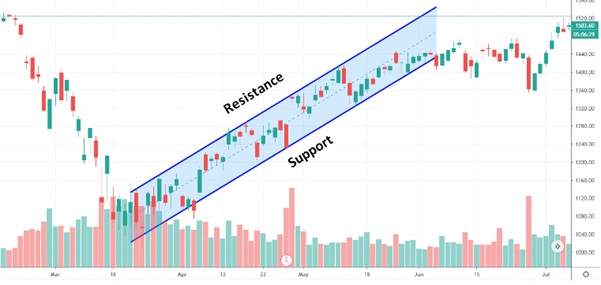
Support & Resistance are not always horizontal lines. Both can be slanted (diagonal) as if forming a trendline (upward / downward). To make a diagonal line can be done in a way:
- Look for 2 or more of the highest or lowest points.
- Connect the highest or lowest point.
Extend the line.
Using Benchmark Numbers
In addition to using lines, many traders also use numbers as a benchmark for Resistance Support levels, for example US$ 100, US$ 110, or US$ 150. These numbers often represent a psychological turning point for traders to determine buying or selling decisions.
A trader will usually start buying when the price approaches the benchmark figure which is estimated to be difficult for the security to fall further down. On the other hand, the trader will start selling a security when the price moves towards the peak near the benchmark figure, making it difficult for the price to pass through that level.
Using Moving Average
The shape of the Support & Resistance area is not absolutely horizontal or diagonal straight. But it can change over time. In other words, Support & Resistance is dynamic.
One way to identify Dynamic Support & Resistance is to use Moving Average. Moving average itself is a constantly changing line that displays and calculates data on past price movements. Usually when prices are above the moving average, the moving average is used as a Support which prevents the price from falling deeper. Conversely, when prices are below the moving average, this line acts as a resistance.
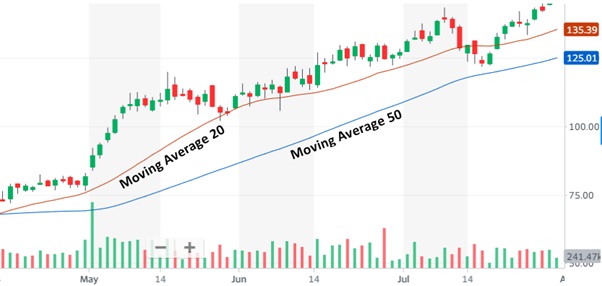
Then, how long is the right period duration used as Support & Resistance? Each trader certainly has a different opinion. Many traders use MA 20 and MA 50 to identify Dynamic Support & Resistance. Or if you invest in the long term, you can use MA 100 or MA 200 to determine your Support & Resistance levels.
Using Pivot Points
A pivot point is a technical analysis indicator, or calculations, used to determine the overall trend of the market over different time frames. Pivot points can also be used to determine Support & Resistance levels.
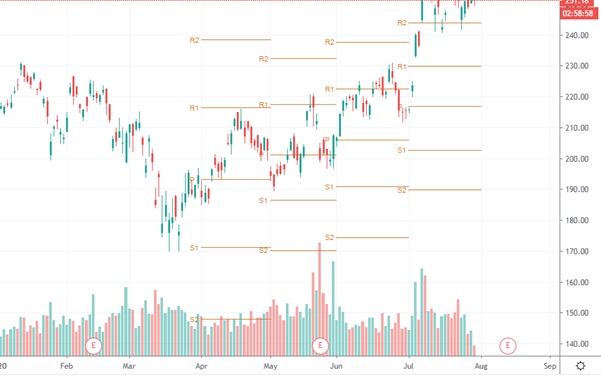
The following is how to calculate Pivot Points:
- P = (High + Low + Close) / 3
- R1 = (P × 2) – Low
- R2 = P + (High – Low)
- S1 = (P × 2) – High
- S2 = P – (High – Low)
where:
P = Pivot Point
R1 = Resistance 1
R2 = Resistance 2
S1 = Support 1
S2 = Support 2