


After yet another manic week, the S&P500 and Dow Jones marched ahead hitting all-time highs to close out the week. Small-caps and the Nasdaq are lagging behind after being the big winners from the March 2020 lows. The first quarter of 2021 has been a case of volatility in the market but we are sitting right now with the market clearly still in the hands of the bulls. Beginning on the positive vaccine news back in November of 2020, cyclical stocks are now leading the pack. With a $1.9 trillion fiscal package, FED continued monetary support, the positive rollout of the COVID vaccine, and consumer cash ready to be unleashed, Q2 looks to be an economic reawakening.
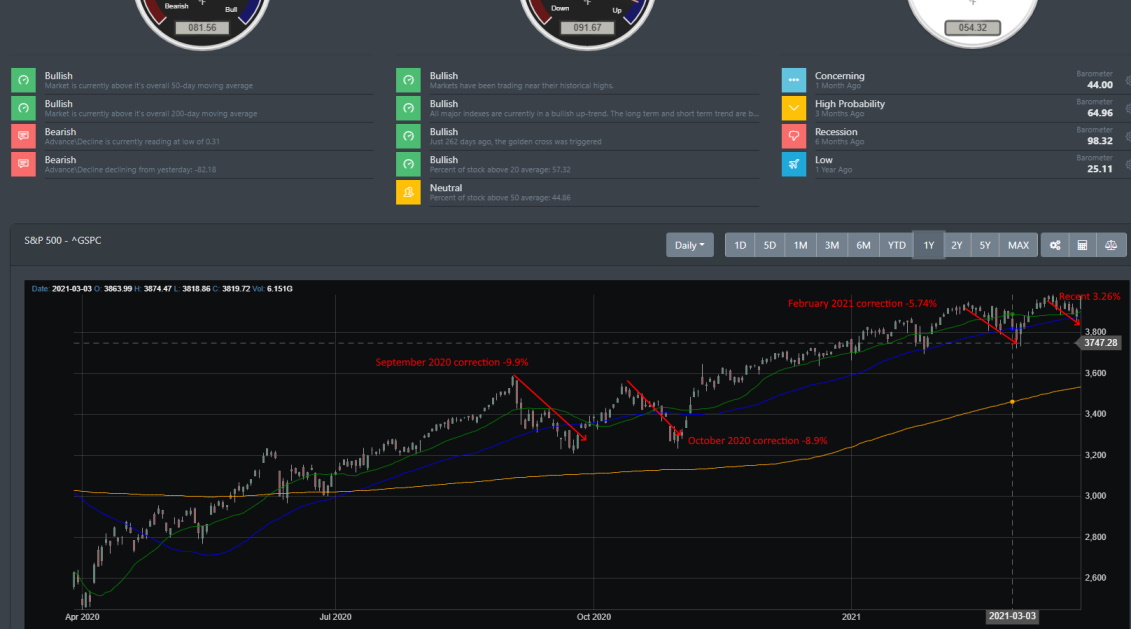
For the past 6 months, there have been about 4 to 5 pullbacks going back to September. When the initial dropped occur, there were many pundits in the market calling for a topping or reasoning as to why the market will end up crashing back to the March 2020 lows. If anything, if we look at the maximum drawdown, we can see that up to the most recent one, the pullbacks are getting more shallow.
| Month | S&P Correction Range | Percentage Correction |
| September 2020 | High of ~3564 to low of ~3209 | -9.96 market correction |
| October 2020 | High of ~3549 to low of ~3233 | -8.90 market correction |
| February 2021 | High of ~3950 to low of ~3723 | -5.74 market correction |
| March 2021 | High of ~3983 to low of ~3853 | -3.26 market correction |
Big Picture
The below chart of the S&P 500 has an annotation of the 4 market corrections that have occurred in the last 6 months. The table above outlines the recent market drawdown during those corrections. With each correction, the drawdowns are becoming more narrow. Now, it does not guarantee any future drawdowns will be fewer or more narrow but it paints a picture that Buys the Dip is certainly in play for the past year.
For this week, Wednesday was the coming-out party for the bears as the market sold off heavily. That was short-lived as the S&P 500 bounced off support levels on Thursday and moved to a new high to close out Friday. The index is by a fraction of its previous high at 3974.28. The Nasdaq and Russell who have been the darlings of the 2020 Rally posted losses for the week.
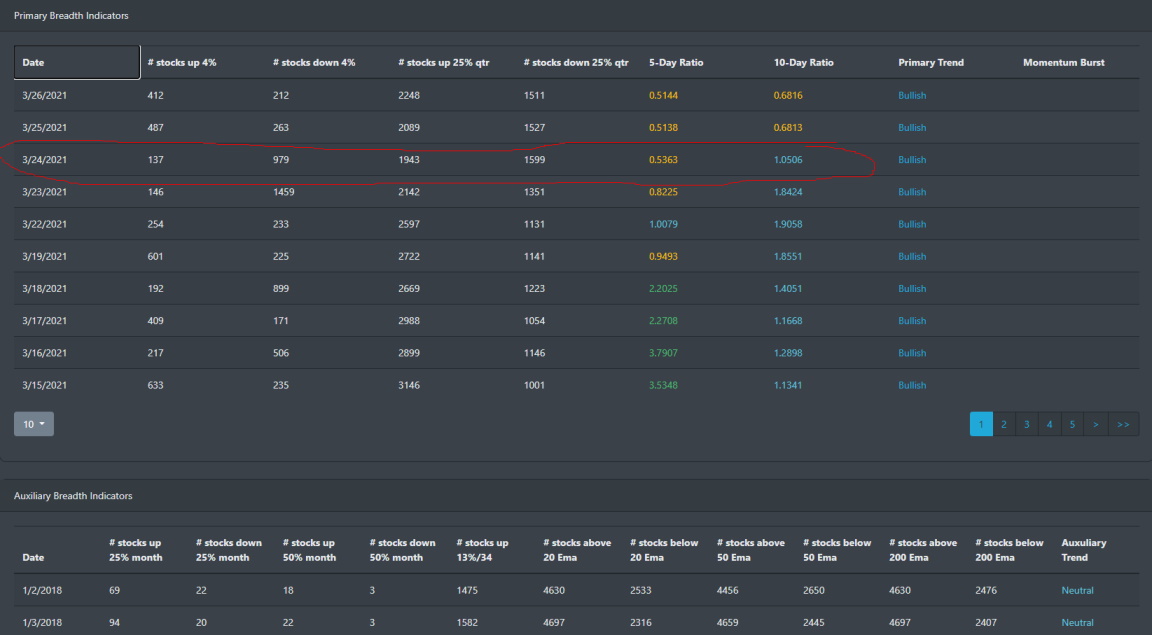
Market Breadth Chart
It has been a volatile month for the financial markets. With the recent market correction, it looks like the market may have reached a bottom on Wednesday 3/24. Market prices have fluctuated from last week and have carried over into this week.
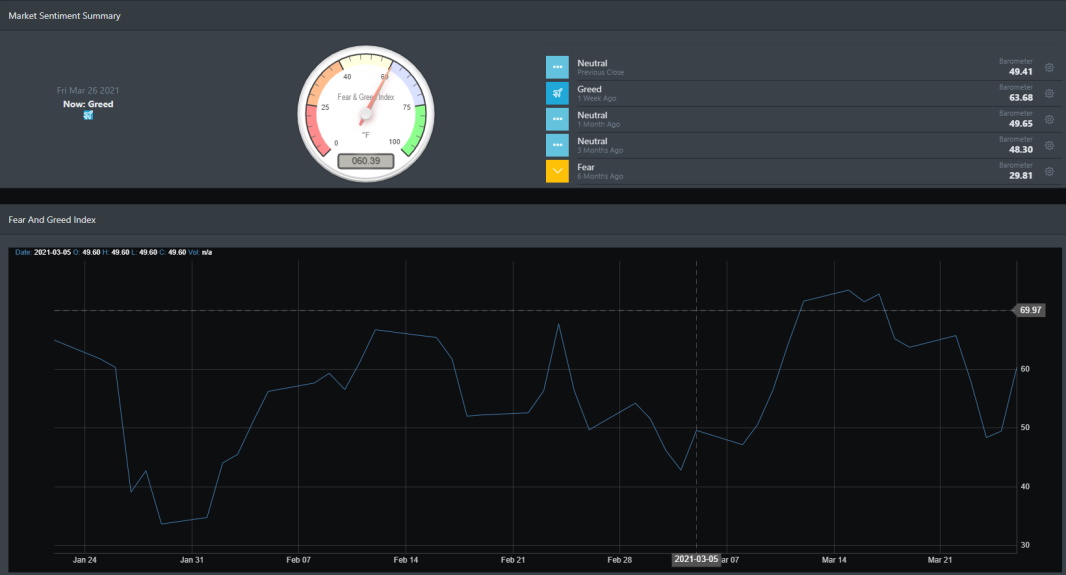
Market Sentiment
Investor euphoria is still evident in BullGap's index as it is still at a high of 60.39. Even with the recent market correction, the index still was at a "low" of the upper 40 levels. And as we discussed in our prior blogs, when the index hits an elevated level of 65 or more, there is typically a drop in the market in the next few days. This occurred again index hit an all-time high on 3/15 at 73.43.
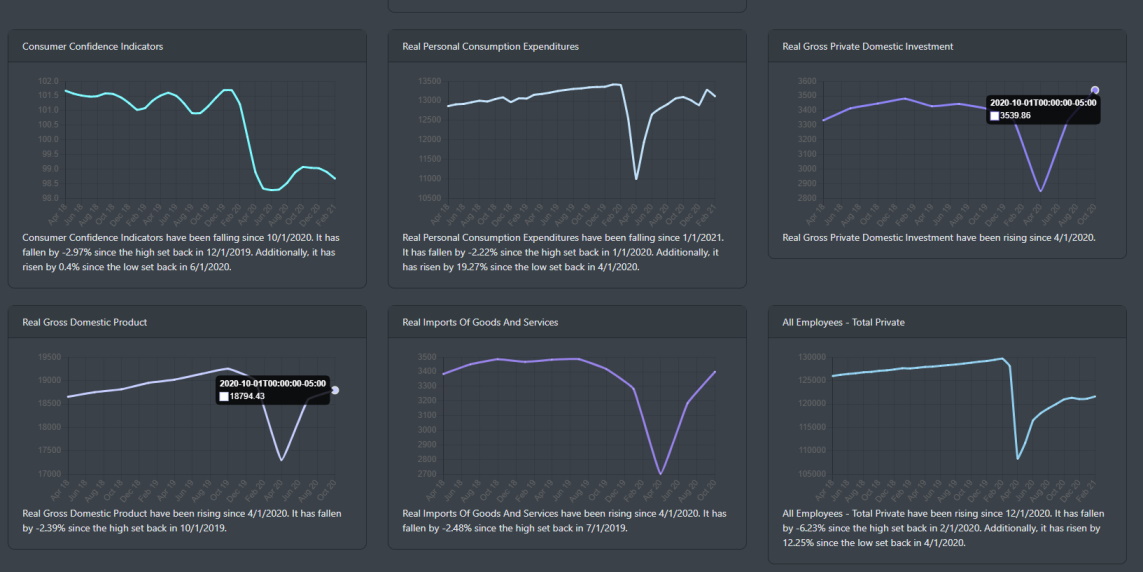
Economic Outlook
The Bureau of Economic Analysis (BEA) released its 4Q20 GDP estimates and the revelation is that the macroeconomic environment is moving in a positive trend. According to the link, real GDP increased at an annual rate of 4.3 percent in the 4th quarter of 2020.
Looking at the chart below, we can see that GDP dropped from 19 trillion in 4Q19 to $17 trillion in 2Q20. It is now near the pre-pandemic levels sitting at $18 trillion. With the $1.9 trillion relief package that recently passed and an industrial stimulus package soon to be discussed, more economic support and activity seem to be on the horizon.
Market Outlook
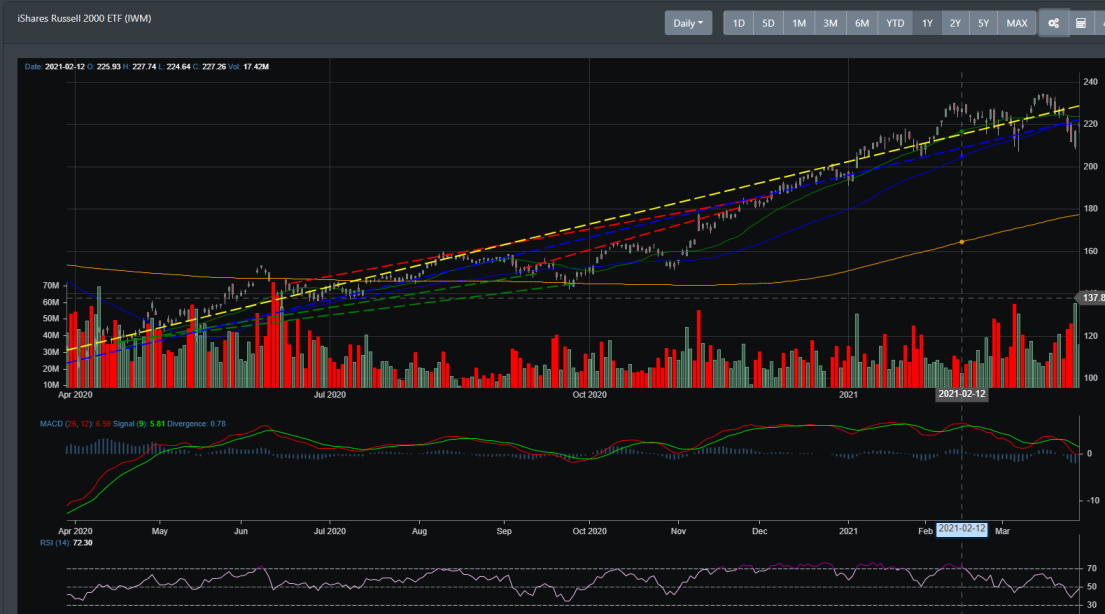
IWM
Starting from last November, IWM\IWC have been on a roll. It has outperformed both the SPY and QQQ but in the past couple of months, it has broken through some key supports. In February, it rebounded from the average trendline (blue dash) but this week it broke through the average trend line on higher volume.
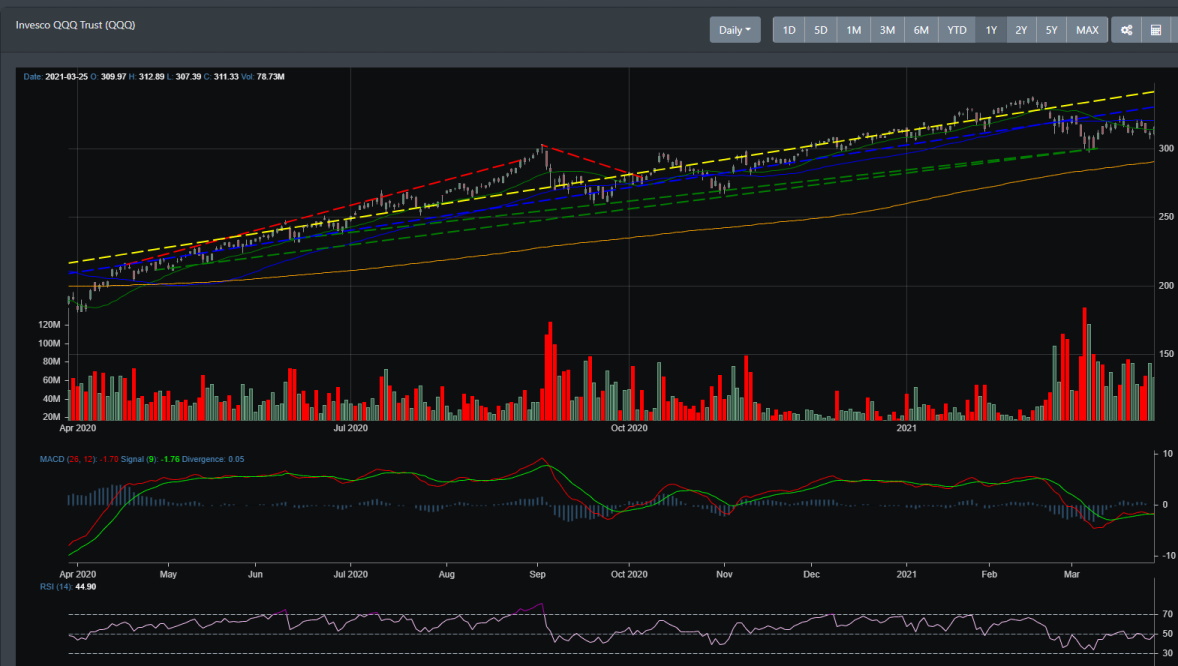
QQQ
With the worries discussed in our prior blogs over rates and inflation, QQQ has been trending down since the start of February. From the chart below, it has traded below the average trend line (blue dash) and on key support. Any break below this, then it could drop to 290 at the 200 DMA. However, QQQ could find itself as early as this week in the rebound scenario as technical indicators show it is in the oversold territory.
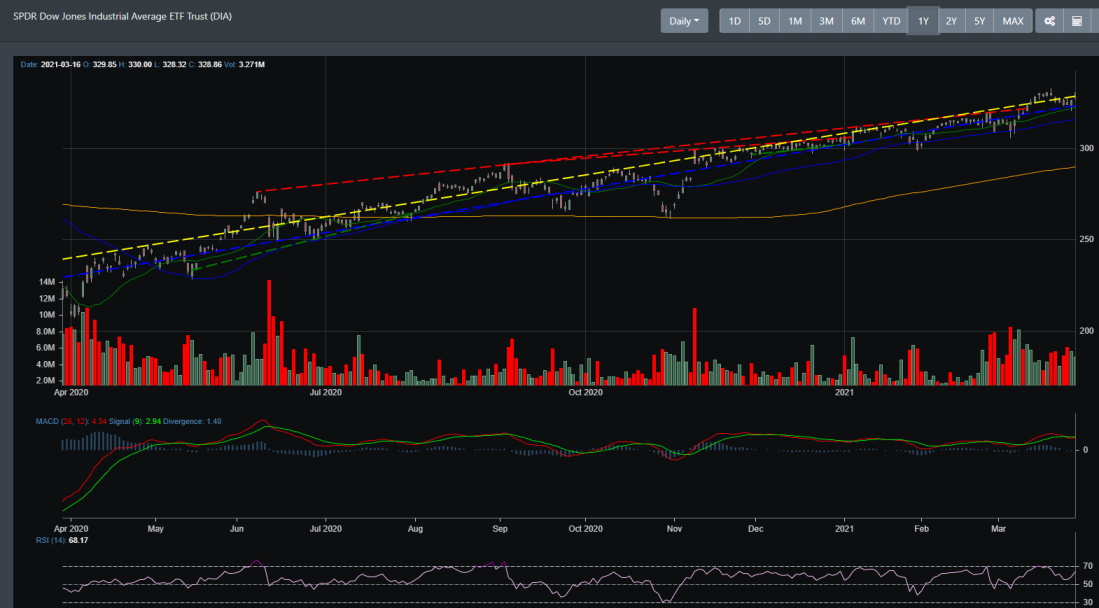
DIA
Starting in early March, the Dow had a breakout. It has since consolidated during the past couple of weeks. On Friday, it broke through to support and it looks like to have more room to move up.
Concluding
Inflation has been garnering a lot of attention lately. With stimulus packages being implemented and additional spending being planned, there are a lot of concerns for investors as to how this will affect the equity markets. That worried has the bears pushing down on the Nasdaq and Russell 2000. Interestingly though, BullGap's market sentiment shows that there is still plenty of bullish sentiment in the market. With a large percentage of stocks still above their 200 DMA and EMA, market breadth is still reading bullish.