


The first week of August is in the books and the markets finished this week in style with the S&P 500, DIJA, and Nasdaq Composite all hitting new highs. The corporate earnings are reporting positive news as earnings beat estimates at a record level. When the news of the delta variant came out, many news pundits were ready to claim that the market would have a deep correction. Well, for the month of July, the S&P 500 has rallied to all-time highs and has posted 7 new highs during that month. So much for the delta variant as it seems the markets have completely ignored the ominous news.
With better than expected July payrolls and improving jobless rates, the 10-year Treasury yield moved 8 basis points at the close of Friday (now at 1.3%). An improving labor market is typically bullish for the market because it helps to boost earnings growth. Though highly unlikely, the Feds did mention earlier this week that they may potentially start the tapering plans on QE. Reduced QEing would push yields higher and thus place a strong resistance on the market.
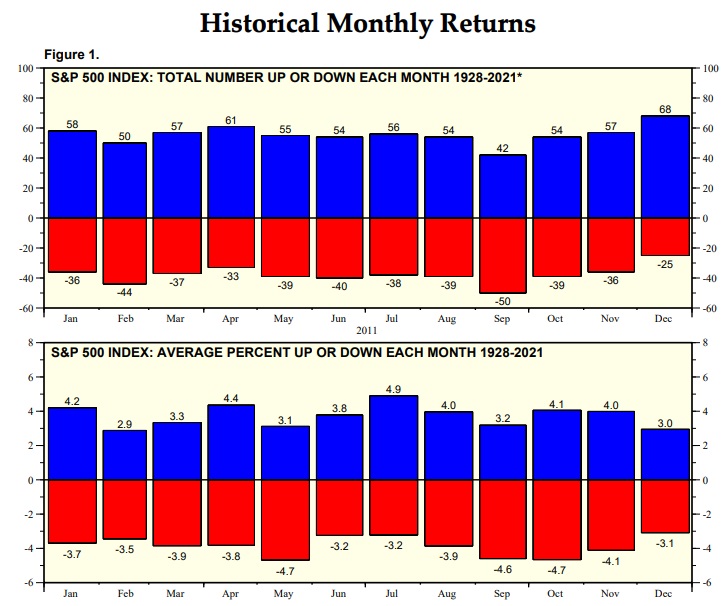
Historically speaking, it will be interesting to see how August and September will fare for the equity market. Since 1945, the S&P 500 has posted the third-worst performance for August. Yardeni Research has posted the following historical performance of the S&P 500. The image below shows that August and September have been historically some of the most volatile and underperforming months for the S&P 500.
Big Picture
With the 10-year Treasury dropping to a low of 1.12% and crude oil moving lower, there was plenty of market analysts calling for the Delta variant as the culprit for the market drop on Monday. However, the next following days, we saw markets reverse and pushed to all-time highs to close out the week. Such is the case when market analyst subscribe to the "next" big issue that will drop the market. A few months ago it was the inflationary concerns. Now, it is the delta variant. It is pretty clear that the market has already priced this in and Monday's dropped was viewed more of profit-taking than negative news pumped out by the market media.
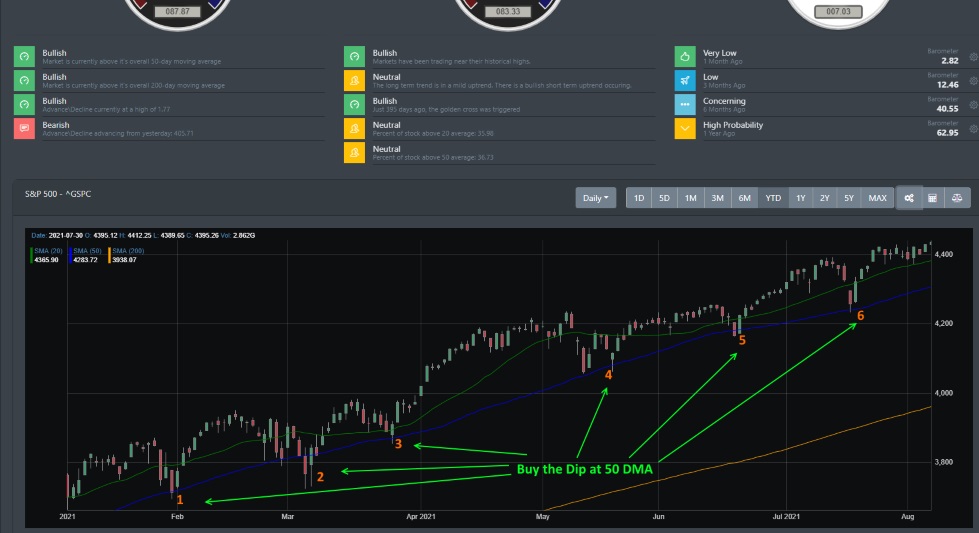
This comes to the point regarding if news affects the market. As we discussed in our prior blogs, we are still currently in a secular bull market. One that began more than a decade ago and is still pushing higher. Did you realize that the S&P 500 has had a +1100 point rally since the March 2020 lows? And all this while the pandemic caused a global economic shutdown and mass news hysteria. If you look at the image below, you can see there were at least 6 market dips for this year alone. And every time the market dipped to near its 50 DMA, investors quickly came in and bought the dip. If you look at this from a purely technical standpoint and ignored the noise from the media, you would clearly see that we are in a bull market. Pushing higher and then consolidating. Rinse and repeat.
Market Breadth Table
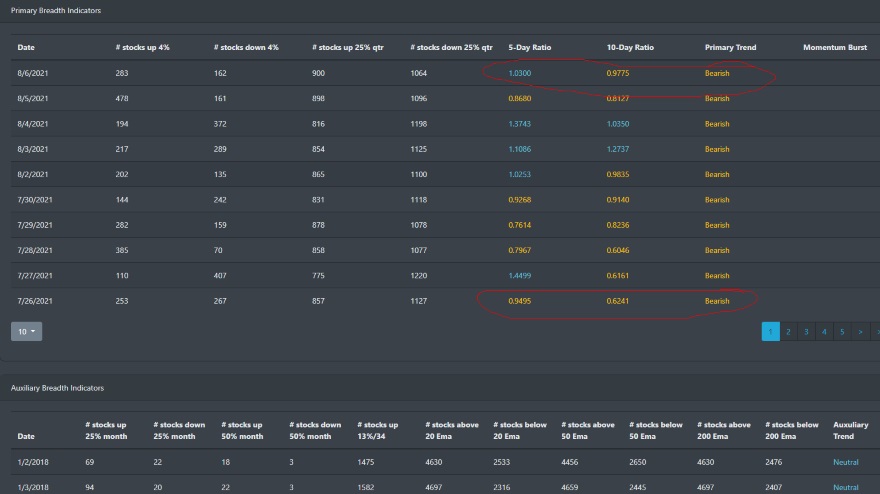
Market breadth currently is showing some bearish activity. In fact, there seems to be a bearish divergence that is in play as markets continue to hit new highs while the 5 to 10-day ratio is in a bearish crossover. Historically, a bearish cross-over signifies a market dip or correction. Currently, markets are grinding higher but the stocks are up 25% versus down 25%, and ratios are reading a bearish signal. This could be foretelling as this may indicate volatility and underperformance are coming in the next few weeks.
Market Breadth Chart
There are a few bearish readings coming from the chart below. The bearish crossover that occurred on 7/22 and the percentage of stocks above their 200 EMA. There were over 90% of stocks above their 200 EMA in mid-February. The percentage has slowly declined to ~65% that is above their 200 EMA. Though the bearish crossover is a concern it is currently narrow but these readings foretell that the market may be in for a volatile sideways movement for the next coming month or two. This reading coincides with August and September being one of the historically underperforming months for the equity market.

Market Sentiment
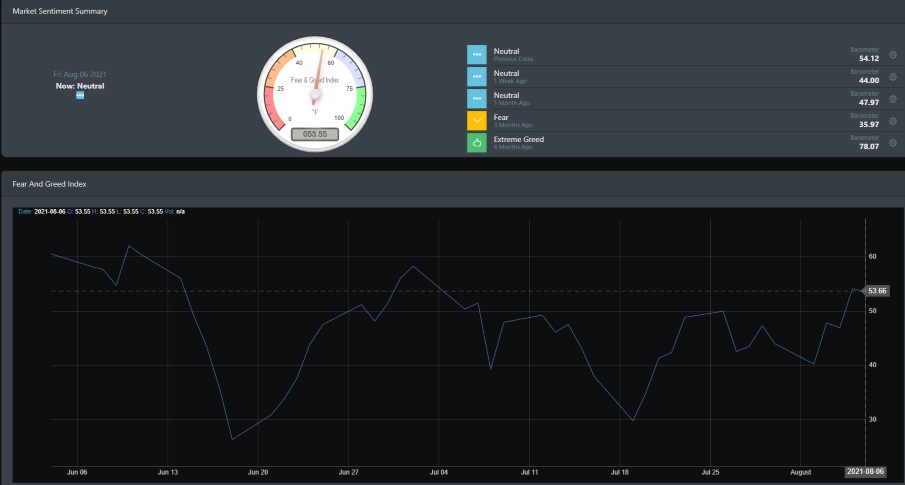
BullGap's market sentiment reading is currently at 53.55 which indicates a neutral reading. While the major indexes are pushing higher, overall investor sentiment has been lukewarm.
Economic Outlook
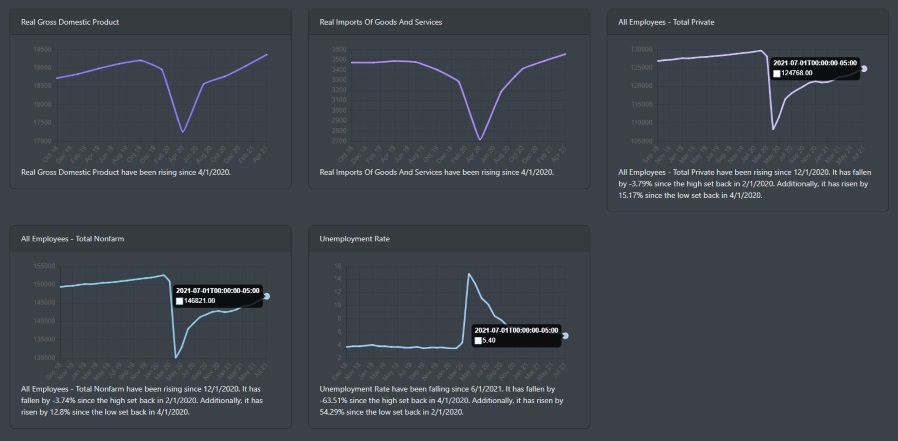
The delta variant has been getting the "nervous" news recently for investors. But it is interesting to see the data on TSA travel numbers where U.S airports are now processing over 2 million passengers a day. It seems that neither the equity market nor the consumers are really concerned about the delta variant "crisis" that the news has been pumping for the past month.
Additionally, the July payroll report posted a better-than-expected forecast. While initial claims still are high at 385K, continue claims dropped below 3 million. From the image below, the All Employee (total Private and Total Nonfarm) is slowly inching higher (but well below pre-pandemic levels). The unemployment rate has been slowly trending lower and is reading 5.40%.
Market Outlook
All things considered, all major indexes other than small-caps are had strong technical readings. In fact, it has really been a "boring" summer for the markets as we are seeing the typical fashion of a bull market in play. Hitting new highs after new highs. Only to see a minor dip that simply gets bought up by FOMO. Let's take a look at the indexes on the daily chart.
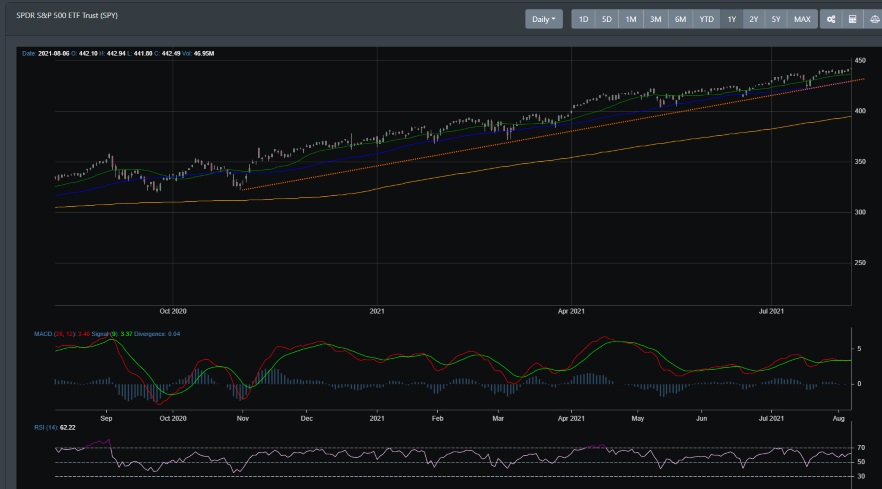
SPY
Looking at the orange dash line, you can see that SPY is still currently in a strong rally that began back in November 2020. SPY is well above its 200 DMA and every price action drop near the 50 DMA has been quickly bought back up by investors.
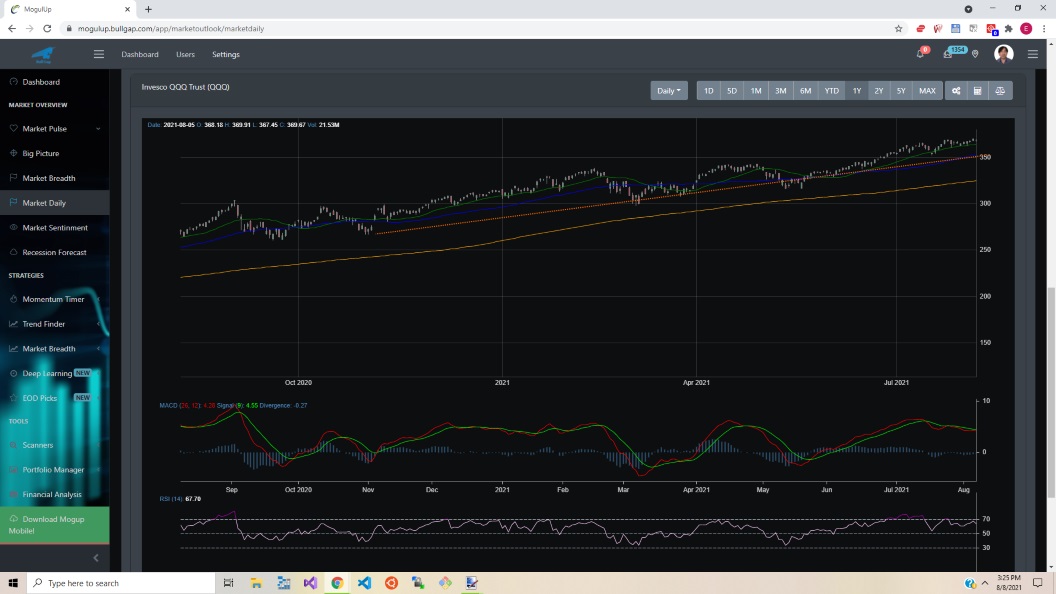
QQQ
QQQ has a similar pattern as SPY. Having consolidated from the March 2020 lows, it has rallied during the start of November 2020. It did consolidate during February and March but has since been the strongest performer among the index.
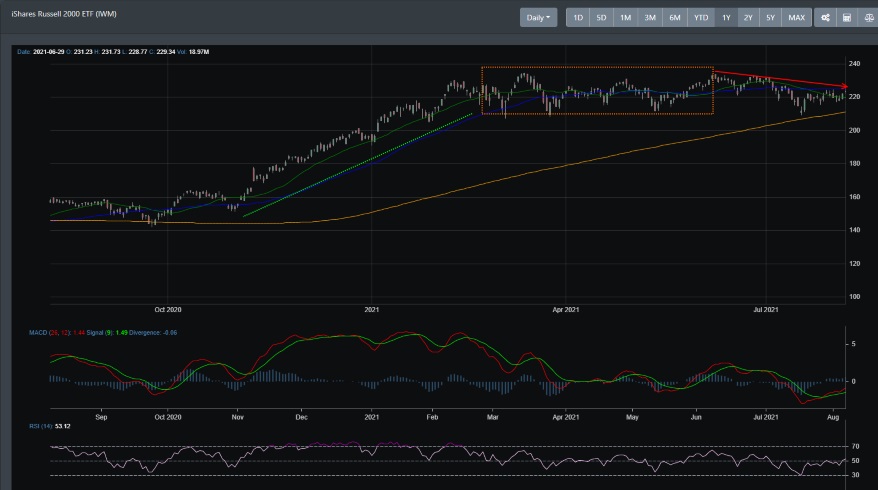
IWM
IWM on the daily chart is still in a consolidation pattern. In fact, the weekly chart is reading bearish and there is quite a bit of downward force pushing on the stock. Since mid-June, IWM has been trending lower.
Concluding
If you as an investor would tune out the negative news noise and just view the charts from a technical perspective, it is clear that the markets are in a rally. Ignore the crowd that calls for a market bubble, inflation stock demise, and delta variant that will cripple the equity market. Follow the trend. And the trend is currently in a bull market.