


For the past few weeks, the bears and bulls have been fighting it right near the 3998 resistance area. The bears have been firmly in control for most of the year with any upside movement from the bulls being short-lived. The bears now are simply in hibernation. As we left discussion in our last blog, Calling the Fed's Bluff! BondMate.., we stated the following about our expectations for the markets in the coming weeks.
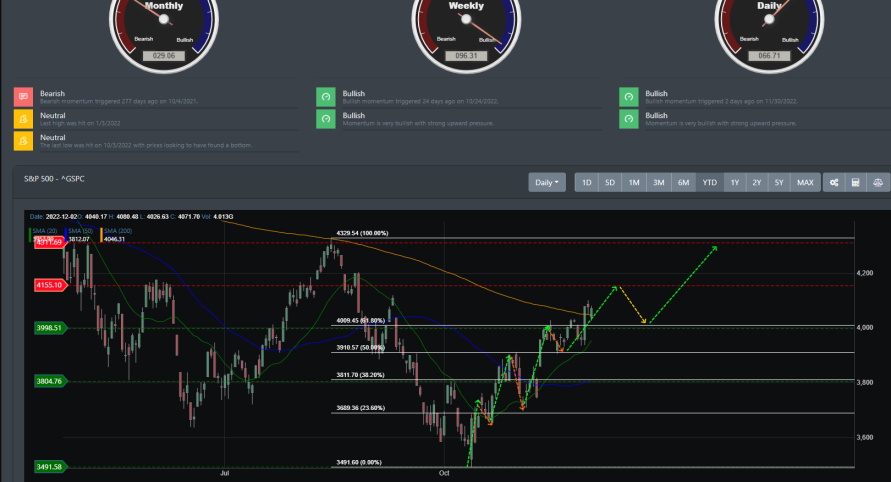
With the bullish technical setup in place, the current rally looks to have more momentum to push higher. However, up next is a test for which the bulls failed to push higher back on August 16. That comes around the 3998 to 4010 region and this scenario sets up the bull for a re-test of the 200 DMA. But before we get there, with the recent daily readings at near-oversold, there should be an expected pullback in the very near term. If the bulls are going to really challenge the bears, then prices need to stay around the 3800 region. And as long as prices consolidate on this support and the rally continues, there is a good chance the next target is the re-test of the 200 DMA.
That excerpt was written on 11/13/22- roughly 3 weeks ago. Markets did have trouble breaking through to resistance. Once on 11/15 and another on 11/25. It did however have a sold breakthrough this week where it did close out right above the 200 DMA. And as stated 3 weeks ago, our expectation was that there would be a re-test of the 200 DMA. Mr. Market had different plans as he did not retest the 200 DMA but rather went through it to close out the week.
Big Picture
The S&P 500 has rallied +14% since hitting its lows back in mid-October. Not to be outdone, the Dow Jones Industrial has gained +20% since hitting its September low. With improving inflationary data and the Feds now stating that they want to avoid over-tightening monetary policies to reduce the probability that it would cause a recession in 2023. Additionally, Chairman Powell mentioned that December could potentially be the time to moderate the pace of rate increases. Markets have used this news as a strong catalyst in pushing higher.
Take a look at the chart of the S&P 500 below. The technical reading is textbook with the S&P 500 rallying to hit resistance on various support and resistance lines. Each green arrow up was met with resistance near the Fibonacci levels from August highs. Each orange arrow down illustrates the pullback that occurred during this bull rally. It is interesting that within this 3 week's timespan, there were plenty of market pundits calling this a bear market rally. As it sits, the S&P 500, Dow Jones, and Small caps are now sitting above their 200 DMA. A clear bullish trend.
Market Breadth
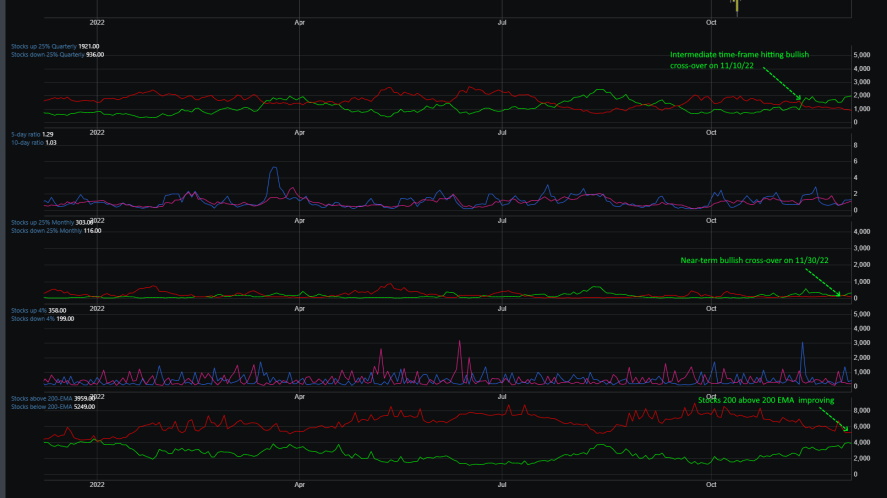
Market breadth has been improving since early November. October was the catalyst where the internal market data was trending in a positive direction. And now with both the intermediate and near-term internal data crossing over to the bullish side and having sustained improvements, there is a strong indication that markets have clearly turned a corner. Stocks about and below the 25% quarterly have been bullish since 11/10/22.
If we take just a look at the image below which renders stocks above\below their 200 EMA, the data is suggesting that the stocks that have been beaten down for most of the year are improving on their technical readings. However, this same reading also occurred twice this year. It occurred around late March 2022 and mid-August 2022 when markets were also having a rally. For those two occurrences, markets fell flat and headed lower after each rally. Will markets move lower this time again? 3rd time is a charm as they say.
Market Sentiment
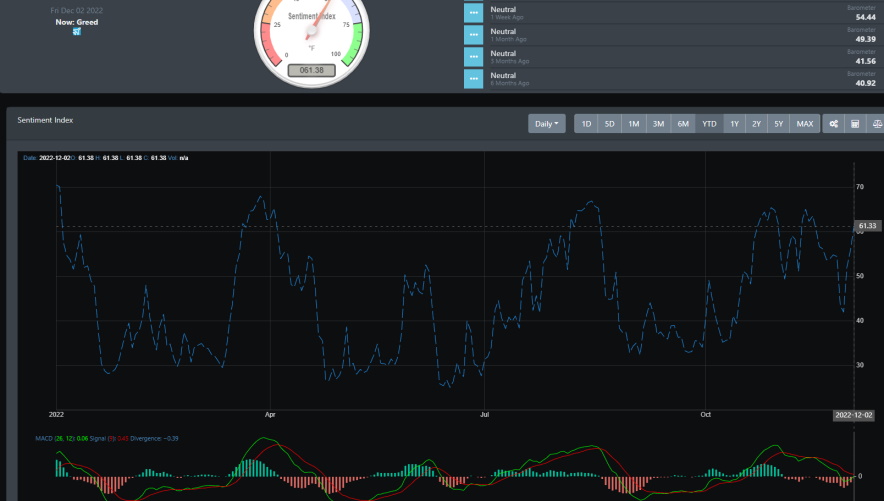
Though for the few weeks, BullGap's market sentiment has been neutral. The readings have been climbing with bullish sentiment being on the move. You can see it with the image below where in the span of 6 months, the market sentiment reading has gone from low fear reading of the 40s to a greed reading of now 61.38. Though a reading above 60 is clearly bullish, the MACD and stochastic readings is suggesting that sentiment still has room to move higher. For the past 2 years in December, market sentiment has closed out December and into early January with a reading above 70.
Market Outlook
For the first time since April, the S&P 500 closed back above its 200-day moving average (DMA). The Dow Jones Industrial and Russell 2000 are also now above their 200 DMA. This is clearly a bullish development and now markets must be able to sustain this support for it to move higher. And as we look at the daily chart readings below, you will start seeing a similar pattern for all major ETFs.
SPY
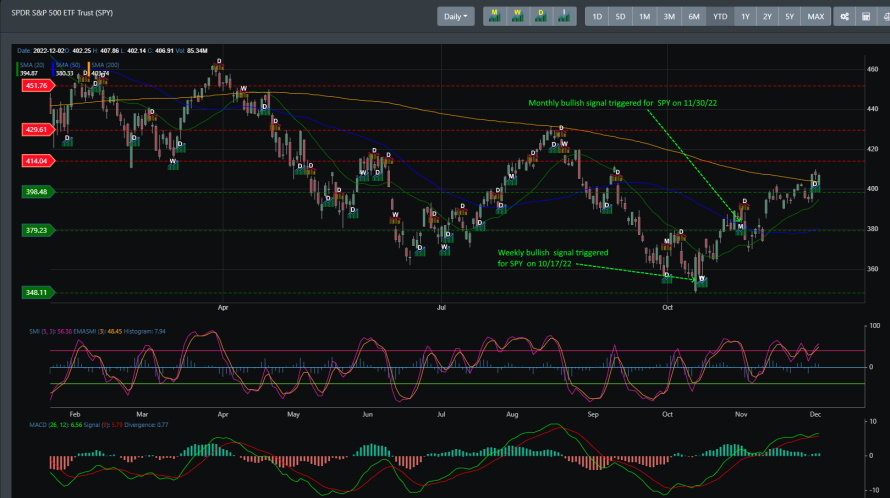
SPY is in a strong uptrend with its weekly and now monthly bullish signal triggering. SPY's weekly signal was triggered on 10/17/22 and with this week's trading session closing, SPY issued its monthly bullish signal as well. We now have the potential for a strong rally to the end of December. SPY has a high potential to challenge its first resistance at 414.04. If there is an impulse rally that breaks through this resistance, there is an even higher potential for it to move up to challenge resistance at ~429.
QQQ
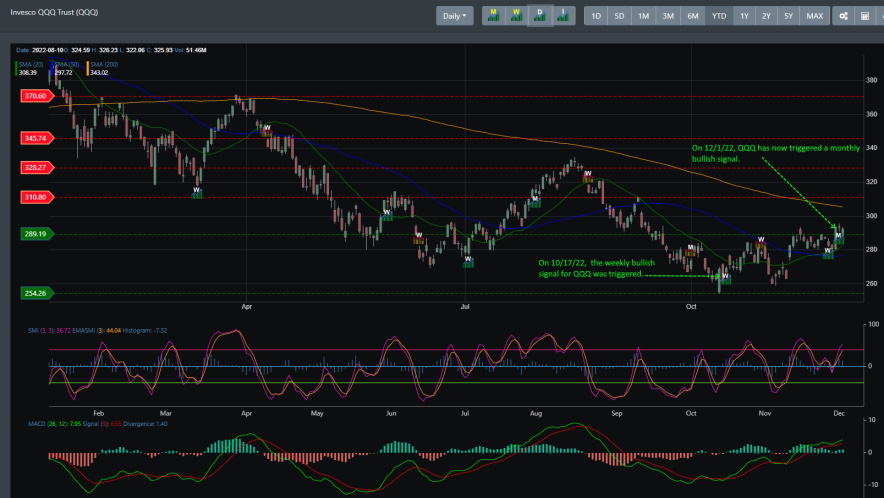
The Nasdaq-100 ETF has been the lagging ETF index for most of the year. With interest rates rising, tech growth has taken a beating all year long. But now, the technical readings are improving for QQQ. Like SPY, it also is aligned in that its monthly bullish signal was triggered for this week. With both the weekly and monthly bullish signals in place, QQQ has a strong upside to challenge its resistance at 310.80.
IWM
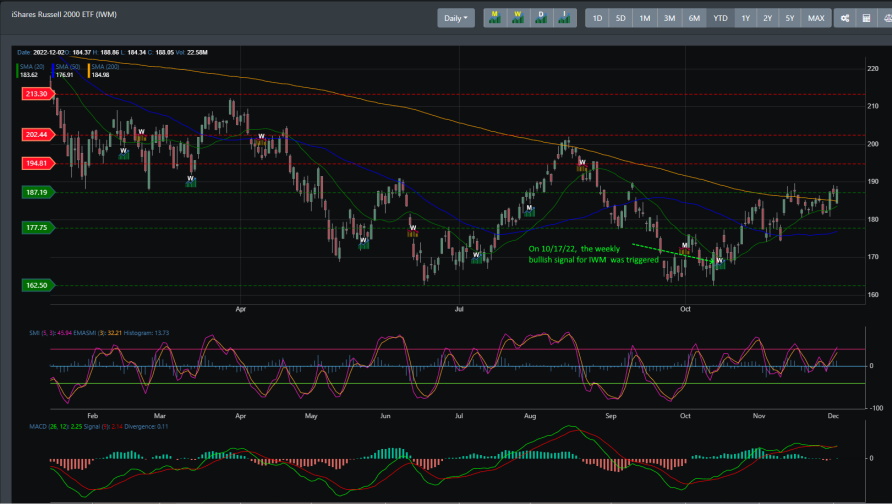
IWM broke through its initial resistance back in early November but has been having trouble breaking through above the 187 resistance line. The monthly bullish signal has yet to trigger for IWM but this week it did close above its 200 DMA.
TLT
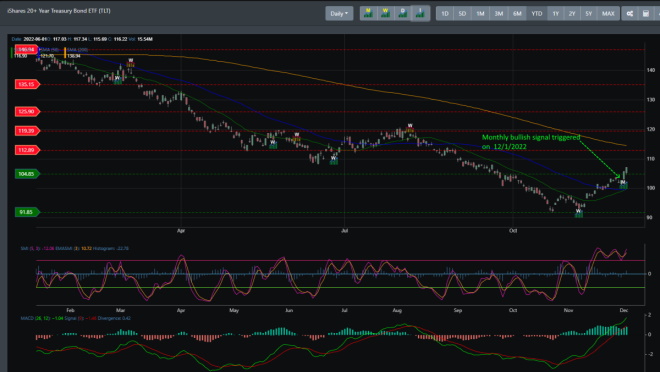
Though we never really examine the ETF TLT, we want to go ahead and take a look at its chart reading below. This is because in our last blog, Calling the Fed's Bluff! BondMate.., we made note that TLT has finally bottomed. And it is clear that since our blog, TLT has been in a major rally. Like SPY, DIA, and QQQ, its Monthly bullish signal was triggered this week.
Concluding
Are markets gearing up for a Santa Rally this year? The S&P 500 broke above its 200DMA back in February and March but soon rolled over. Can this happen this time around? Potentially but not likely as those two rallies occurred within a monthly a weekly sell signal.
On one of our recent blogs, Dawn of a new bull rally, we stated the following.
Financial markets move in cycles and we can see that in underlying data points. The reversal patterns, whether they are bullish or bearish, will eventually line up where all major market indices flow in the same direction.
We are seeing that now with our monthly bullish signals triggering for the S&P 500, Nasdaq, and Dow Jones. The Russell 2000 which started the October rally has yet to trigger its monthly buy signal but our expectation is that it will occur before the end of the new year. With major indices now above their 200 DMA and monthly bullish signals set for most of the major indices, the potential for a Santa rally for 2022 is high. With all that said, we still expect a pullback to occur before we move higher. Support is currently now at ~3998 region with a possible move down to the 3804 if 3998 does not hold.