


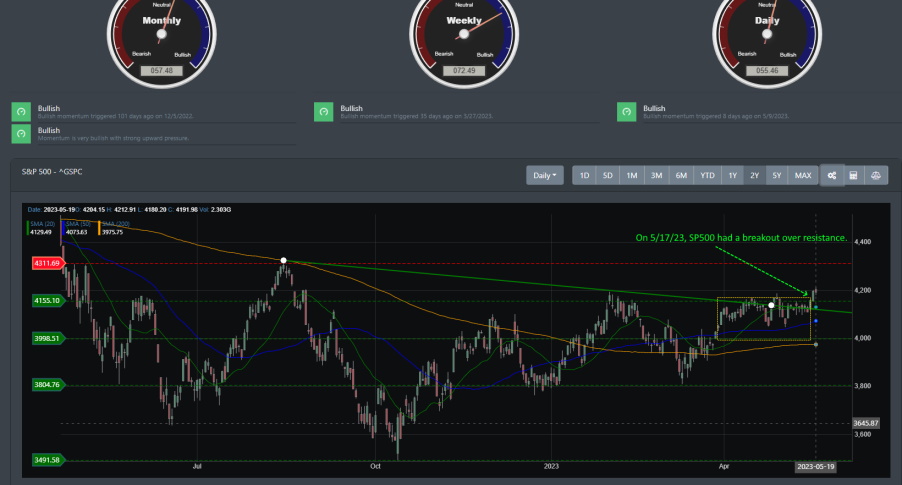
After rallying from mid-March to mid-April, markets have started May with some consolidation along the 4146 region. While volatility has been at the forefront for most indices, we have a recent breakout. The S&P500 broke through resistance this week while the Nasdaq hit a new 52-week high. The bulls are in control now, with markets roughly 16% above the October lows in 2022. Not so long ago, many market pundits called the rally off the October lows a bear market rally. Their logic was that inflation and recession would send markets lower. That has not happened, and much of that noise has since settled, and the bears are now grasping at any straw to drive the bear market narrative. The S&P 500 made a low about six months ago, and if history is any indicator, there is a high probability that the S&P 500 will be higher in the next six months.
Big Picture
After a consolidation period for most of May, markets fired mid-week to break resistance near the 4140 to 4160 region. As discussed in our last blog in mid-April, markets were rallying to challenge resistance in the 4140 region. There were fears that the CPI report due in May would run hot, sending markets back to the October lows. We did not see this as a plausible case but stated the following:
"Markets are now technically oversold, and a pullback looks in order. The question is, how deep will this pullback be? There is a high probability that markets could pull back and catch support near the 4069 to 4072 region. If it does not hold at the 4069 region, the next drop will be near the 4006 region, where there is strong support.
If markets do not break through to resistance soon, there is a high probability of a pullback. If this occurs, we see this as a buying opportunity. Buy the dip."
If markets do have a pullback...buy the dip. And markets did pull back. Twice. And if you bought the dip, you would be sitting in a good position with markets poised to challenge the August 22 highs.
Market Breadth
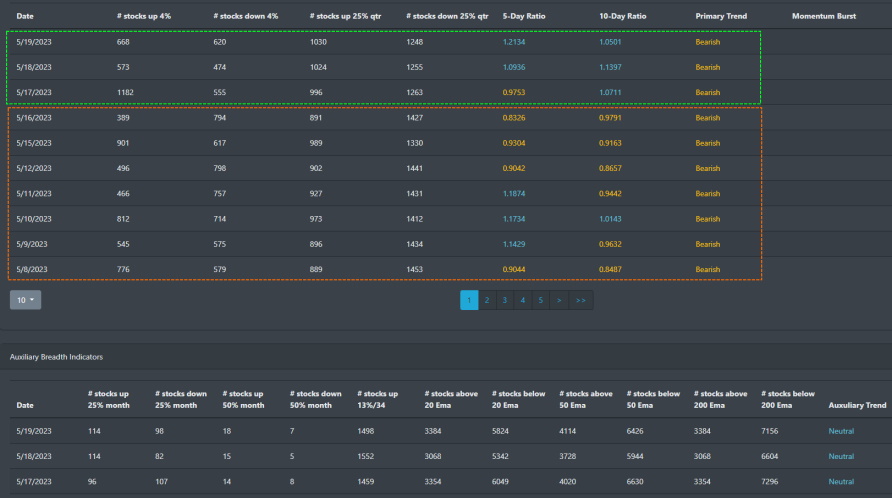
As the current rally grinds ever higher, the market breadth for most of this year has been weak to moderate. As a result, only a hand full of mega-cap technology stocks are responsible for this year's index rally. However, a bullish burst was set back on January 12, 2023, and fired. This signal gets triggered when the 10-day ratio of stocks advancing and declining exceeds 2.0.
Market Sentiment
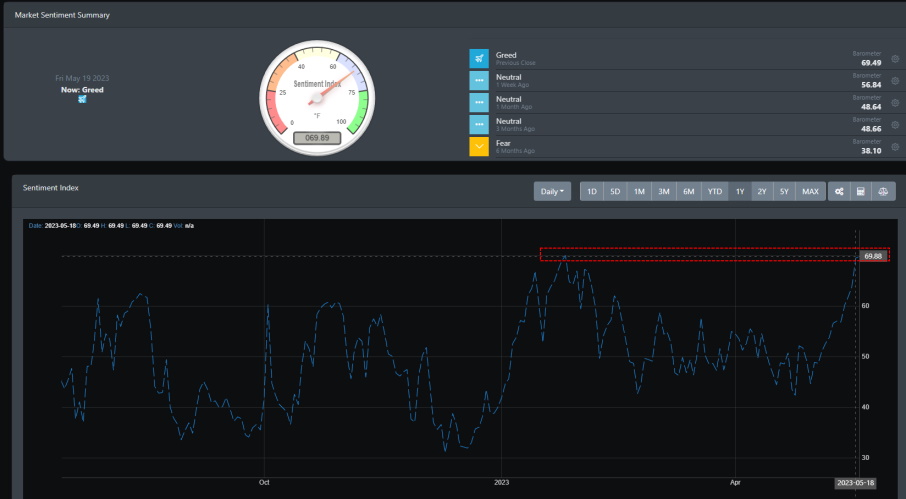
After being in fear and neutral sentiment for the past three months, market sentiment this week has pushed into greed mode. Our sentiment index reading closed out Friday with a reading of 69.79. The last high was on January 27, when markets topped out following the high reading. Similarly, markets topped out a month later when our market sentiment hit a high of 84.47 on November 3, 2021. Markets could be poised to settle and consolidate after breaking through resistance this week.
Market Outlook
Markets were poised for consolidation after rallying strongly to start the year. And as we suggested in our last blog, we expected to see a pullback coming in April and potentially May. With technical readings still in overbought territory and their weekly time frame consolidating, we did not expect a rally to ensure even with the positive CPI\PPI report in May. Markets did rally mid-week but sputtered out to close Friday's trading session. Is there still more upside to the current rally? Let's take a look at the charts on the daily timeframe.
SPY
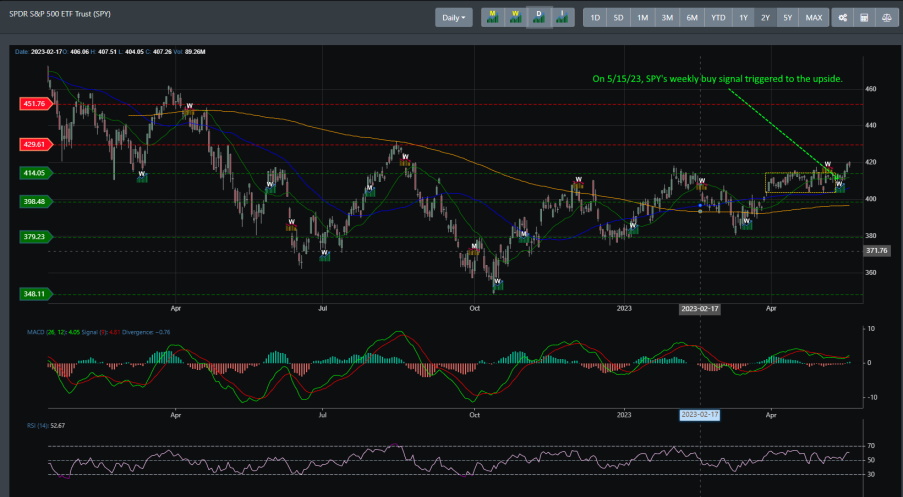
The chart below shows a range-bound consolidation period that starts in April. Notice that a weekly bearish signal was triggered in early May that could have potentially broken resistance near the 399 region. However, that was short-lived as SPY did push higher to move past resistance near the 413 region. There is new support on the last resistance line at around 413. SPY could look to consolidate in the short term, but the recent weekly bullish signal indicates that SPY is looking to challenge resistance at around the 429\430 region.
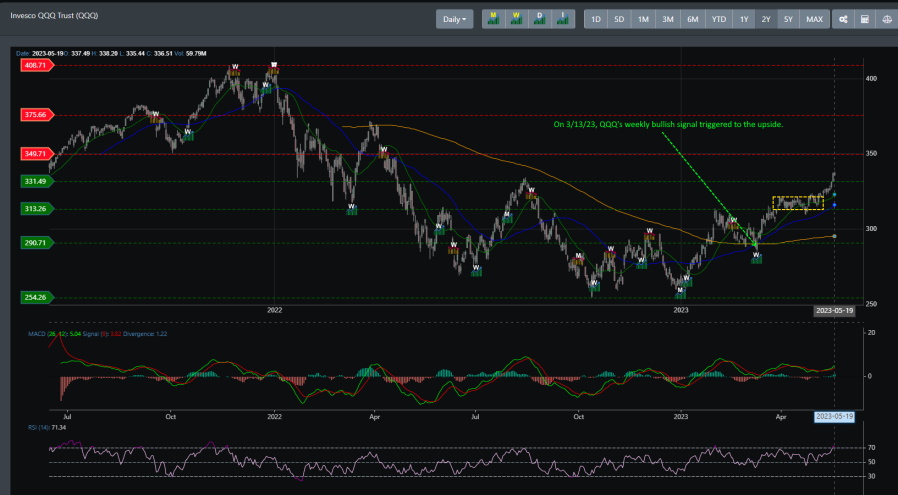
QQQ
QQQ has been on a roll since its weekly bullish signal was triggered on March 13. It has since broken through 2 resistances and is now setting its sights on the 349 region/ Support is now at 331, and there is a high likelihood that QQQ will start to consolidate before moving higher.
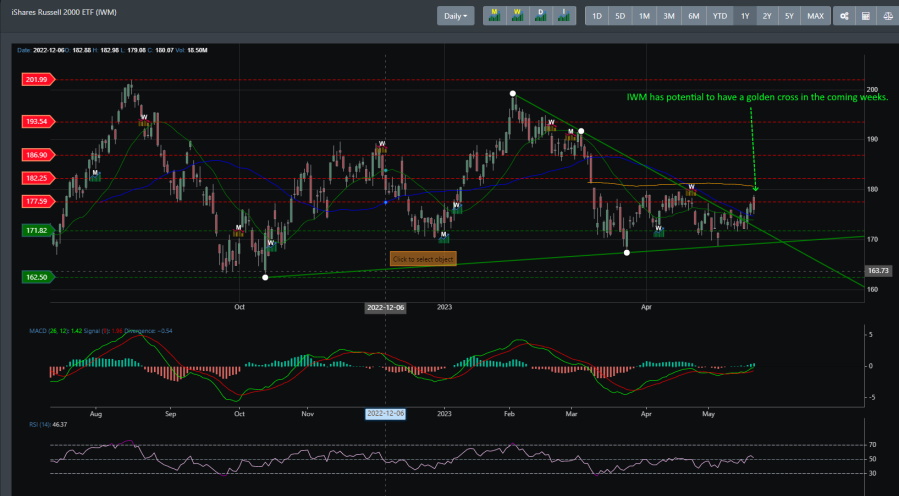
IWM
IWM has been in monthly bearish and weekly bearish signals since late February. It has thus far been lagging behind its counterparts. Still, if we view IWM on the weekly timeframe, there is potential for a solid rally to form in the coming weeks. IWM must break resistance at the 181 region within a weekly bearish signal to establish a strong rally.
Concluding
After consolidating for most of May, the S&P 500 had a breakout this week. The technical landscape is highly favorable for markets, and though we expect some consolidation to continue, the chance of financial markets moving higher is highly likely. If IWM can get a weekly bullish signal and break through resistance, it can potentially lead markets in the coming months. With SPY and QQQ leading the current rally, it is only time for IWM to have a breakout. An IWM breakout would be a tailwind for the market as it will signal broader market strength, but it could also strengthen the rally that started back in October of 2022.