


Stocks had a strong rally this week with small caps (Russell 2000) and tech stocks (Nasdaq Composite) leading the charge. As we discussed last week in our blog, we saw several signals turning bullish that could help push the market up. As of now, the 10-year Treasury is trading in a narrow range of around 1.5%. With the Fed's suggesting that they believe the current inflation to be purely transitory, market participants ran with this and help push the Nasdaq into another positive week.
An important event is coming up this week as the May unemployment report will be issued on Friday. The expectation is that the US will have created over 650,000 jobs and the unemployment rate will drop to around 5.9%.
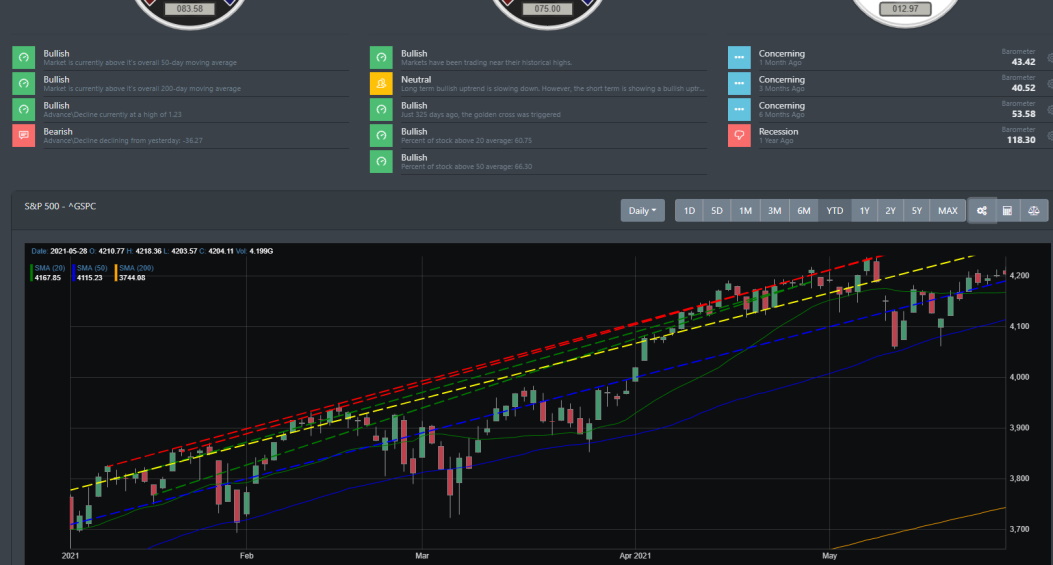
Big Picture
In terms of performance, May has certainly been a benign month for financial markets. However, for this week, markets had a strong rally to end the month of May. Both the S&P 500 and Dow will close this month with less than 1% of their latest high. Nasdaq is only 4% off its recent high. May 2021 may have been an underperformer for the entire year but it definitely was not the gloom and doom many market pundits were calling for. There was no major correction in May nor was there any market top to be had.
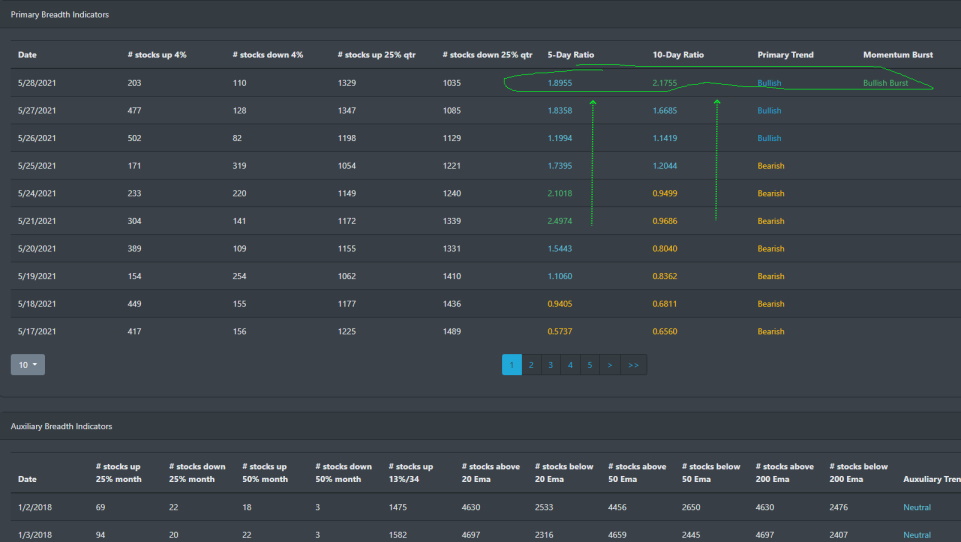
Market Breadth Table
This month may go down as one of the most underperforming months for 2021 but this week has been an entirely different story. As we discussed in our last blog, there were indications in our market breadth data and technical readings that suggested a change in direction was coming. Well, looking at the data below, it is clear markets went from hitting low in the 5 to 10-day ratio to now moving into strong momentum. In fact, on Friday 5/28, the Bullish Burst was triggered.
The last time a Bullish Burst was trigger was back on 2/10/2021. The S&P 500 went from the 3880 range to 4236 within a 2-month time span.
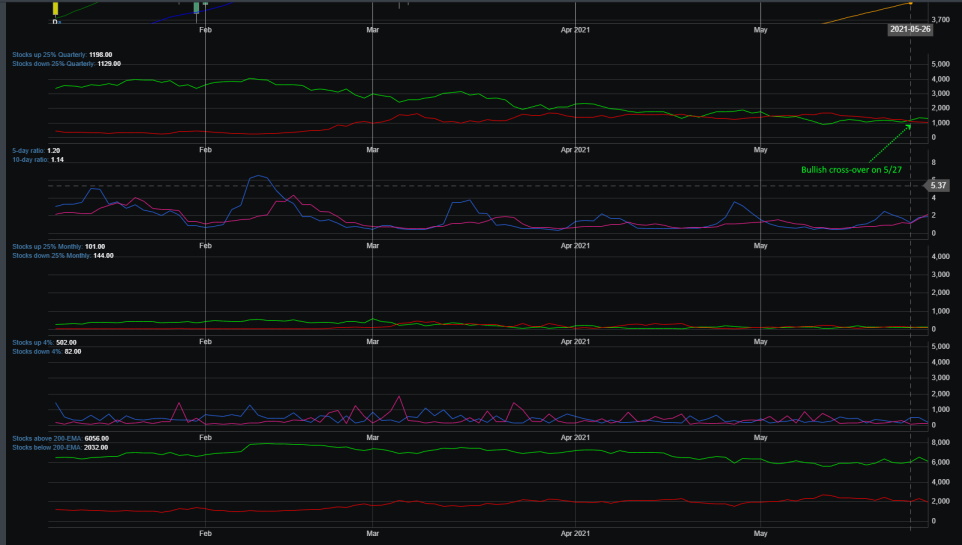
Market Breadth Chart
Market breadth is still strong and momentum is looking to pick up. There is still a large percentage of stocks above their 200 EMA. You can see in May where the 5 and 10-day ratio crossed over the bearish side but has since reversed. Also, stocks up 25% quarterly also triggered to the bullish side.
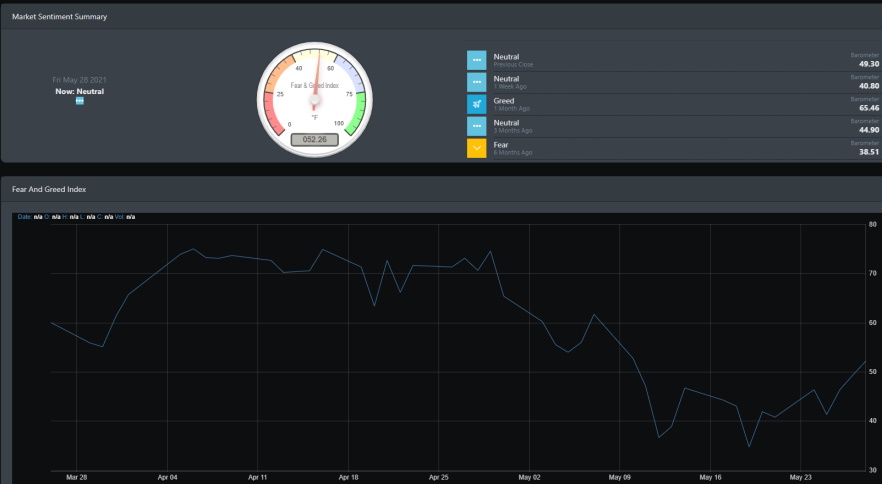
Market Sentiment
Investor sentiment has been overly bullish for the majority of the year. April was an outlier where BullGap's Sentiment index was averaging above 68 for the entire month. And right on cue, May came and took the sails out of the bulls. Interestingly enough, SPY has market participants taking one of the largest short positions for 2021. Short for SPY has been on the rise through the month of May. It is currently over 4.5%.
Economic Outlook
There was good news coming out of the economic front as the initial jobless claims fell to 406K vs 450K. The 4-week moving average is trending lower at 458.75K. Now, let's review some of the long leading data shown in the chart below. The Fed's QE policy has been on a slow uptrend for the past decade but kicked into high gear right around the time the pandemic hit in early 2020. The M2 money velocity has been curtailed while the liquidity has dramatically been expanded. M2 velocity is the measure of how quickly money is exchanged during economic activity. Right now, there is lots of money flowing but not into the business cycle. That money apparently has made its way into the financial markets. Now, consider what may happen when the economic activity pickups (economic re-opening) and there is plenty of money flowing around. Well, with money readily available and the constraints of the supply chain, we could see a run-up in inflation.
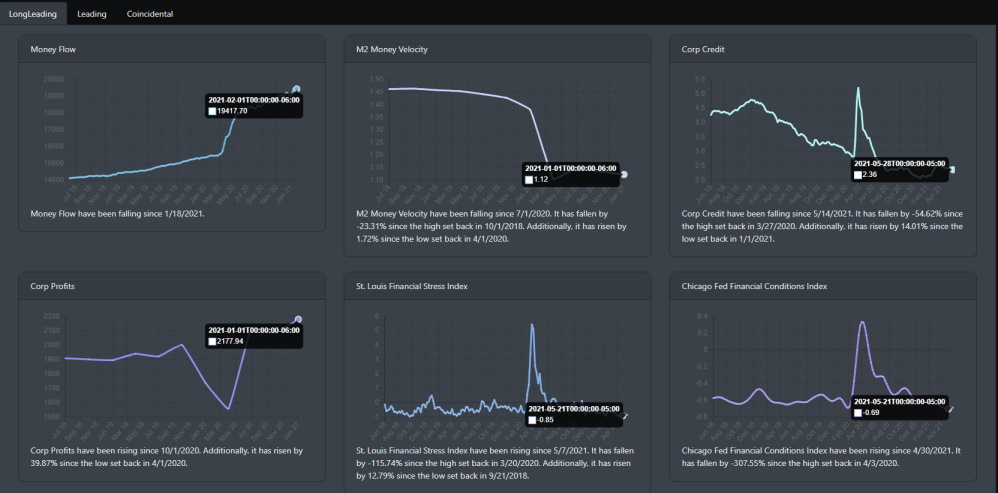
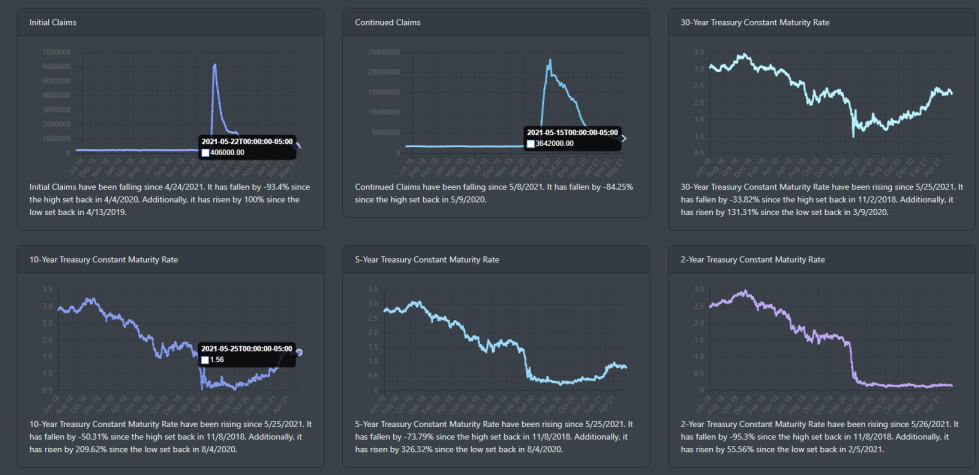
Initial claims continued to move lower as the seasonally adjusted initial claims sit right at 406,000. That is a decrease of 38K from the previous week's level of 444K. This is the lowest level for initial claims since March 2020.
Market Outlook
Markets made a rebound this week and with the buy signals coming from last week, we mentioned in our last blog that a rally was coming. Overall, on the bigger time frames, markets are in a sell signal. But there is upward momentum pushing on the intraday and daily charts that are showing up on the overall stock market.
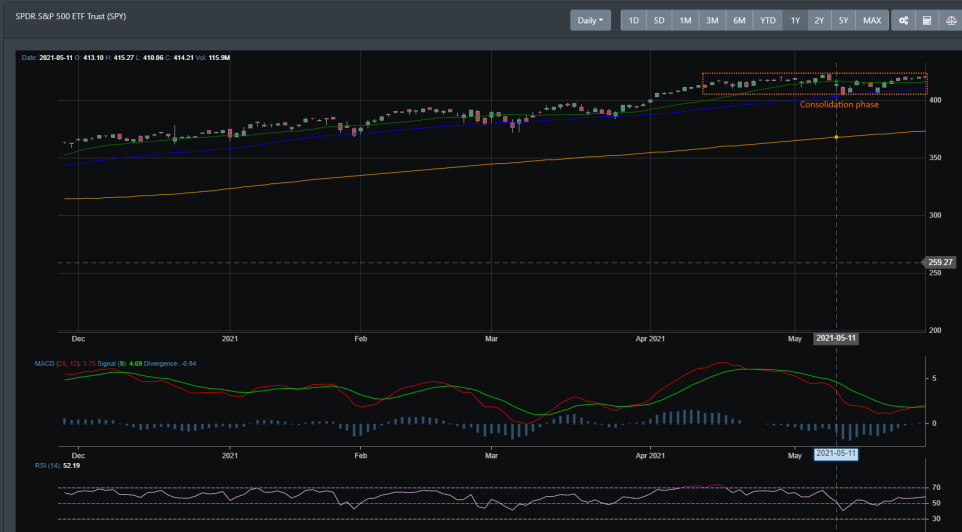
SPY
Since the March lows of 2020, SPY has rallied more than 92%. Looking at the daily chart, you can see a sideway action occurring in the month of May. The MACD sell signal triggered on the weekly and daily chart and with this much downward pressure, you would expect a correction. But that has not been the case. This bolds well for the bulls as we suspect that SPY is consolidating due to the huge rally off the March 2020 lows.
QQQ
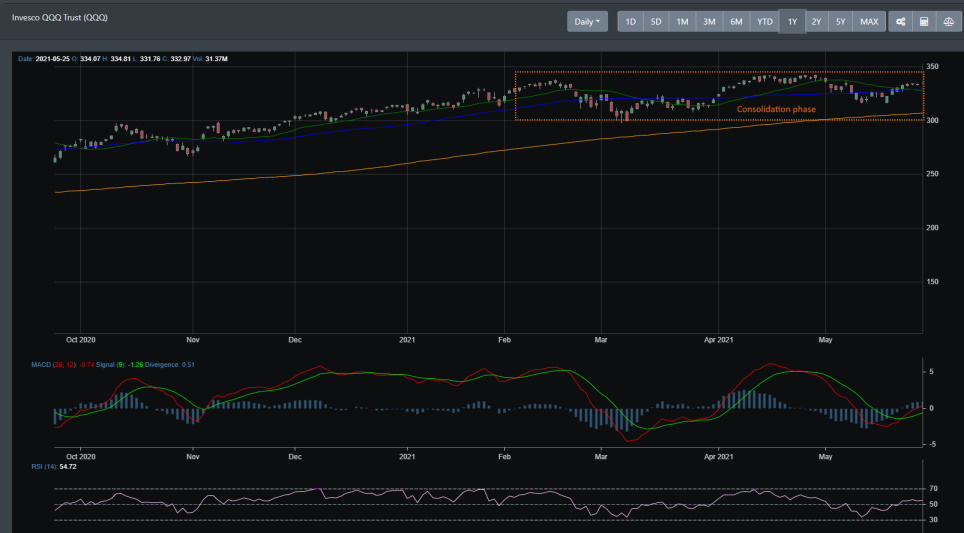
QQQ also advanced over 105% since the March lows back in 2020. And from the daily chart below, you can see that prices have been trending sideways for a good part of the year. Not until this week are we sending renewed interest in large caps.
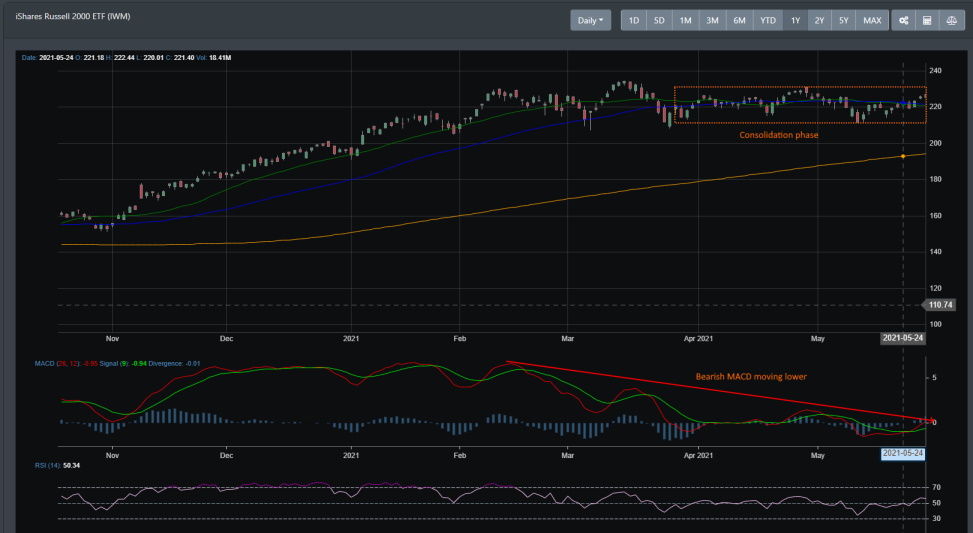
IWM
Like SPY and QQQ, small-caps have had an impressive rally of over 150% since the March 2020 lows. Prices have been moving sideways since mid-February 2021.
Concluding
May is behind us and with our current market indicators, it looks like anyone calling for an imminent correction is going to have to wait a little longer. Eventually, this camp of gloom and doom will be right. But for now, all of our market readings point to the S&P 500 getting ready to take another shot at its old high of 4233. All major indexes are now sitting above their 50 DMA and market breadth is pointing to another momentum push to the upside.