


Historically, September is the worst month for the stock market. The S&P 500 typically offers poor performance during this time and September 2021 has been no different. Last September, the S&P 500 was down roughly 4%. This September, the S&P 500 was down more than 4.7% - the sharpest decline since January of this year.
Let's review what happened this week. On Monday, the bears were out in full force as price action dropped the S&P 500 into intermediate support (right around the 4200 level). In our last blog, we mentioned that if the market does not hold the 4430 regions, there is more room for it to fall. It did just that on Monday. However, just when the bears were ready to celebrate, the market did a reversal and closed the week in positive territory. All major indices except Small caps (IWM) posted positive gains for the week. If one were talking about an impending correction, one would have to look at where the market is currently at. The S&P 500 is now only 3% from its all-time high, the Nasdaq and Russell 200 are 5% below its recent all-time high and the Dow Jones is 2% below its all-time high. Not much of a dip or a correction to discuss but do not let the market gurus or pundits tell you otherwise.
Big Picture
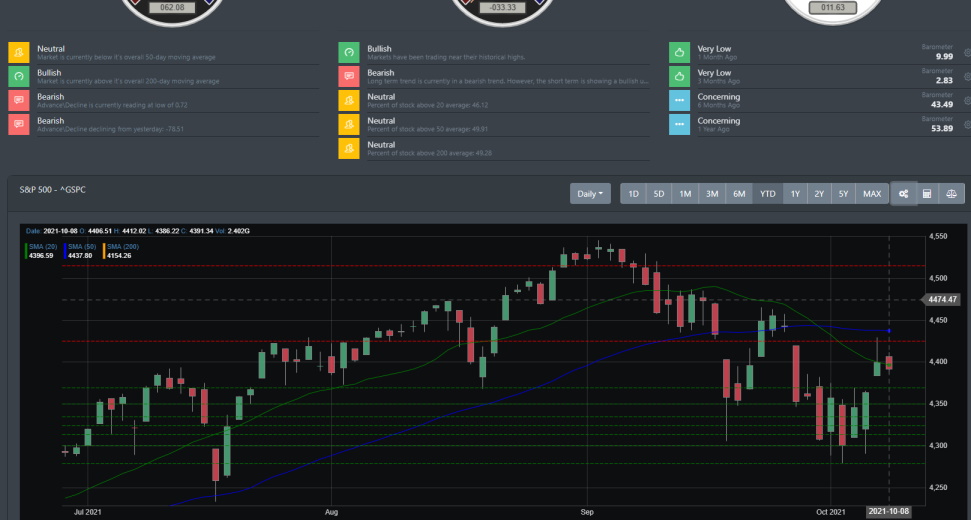
The market "dip" in September has pushed many of the short-term indicators into oversold territory. While the near-term technical readings are oversold, the intermediate and long-term indicators are still bullish and would indicate a rally could be underway. That said, the S&P 500 is in a precarious state. It closed the week at 4391 where it straddles both the resistance (~4425) and support (~4369). If markets can hold this support, there is a high probability we see that a near-term rally where it will challenge its all-time high. If it is unable to maintain support for this upcoming week, we could see another dip that drops the market into the 4200 support region.
Market Breadth
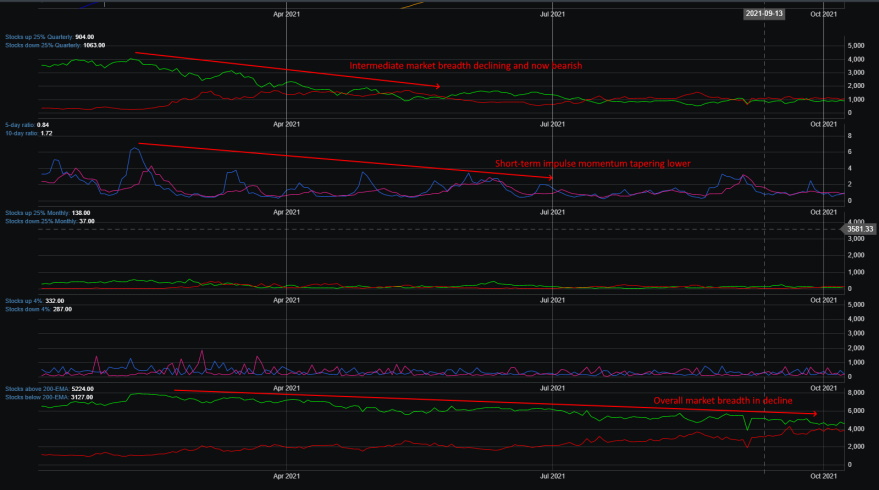
Market breadth is suggesting that the number of stocks in the oversold region is high and due for a reflexive rally. However, the overall market breadth for much of the year has been quite bearish. Looking at the image below, we can see that since April market breadth has been trending lower. Short-term market burst signals have less magnitude and duration. This should not be alarming at the moment as markets go through a cycle. Last year, we had a similar scenario during the month of August to November 2020. At the moment, this looks like markets are consolidating after a strong rally from the March 2020 lows.
Market Sentiment
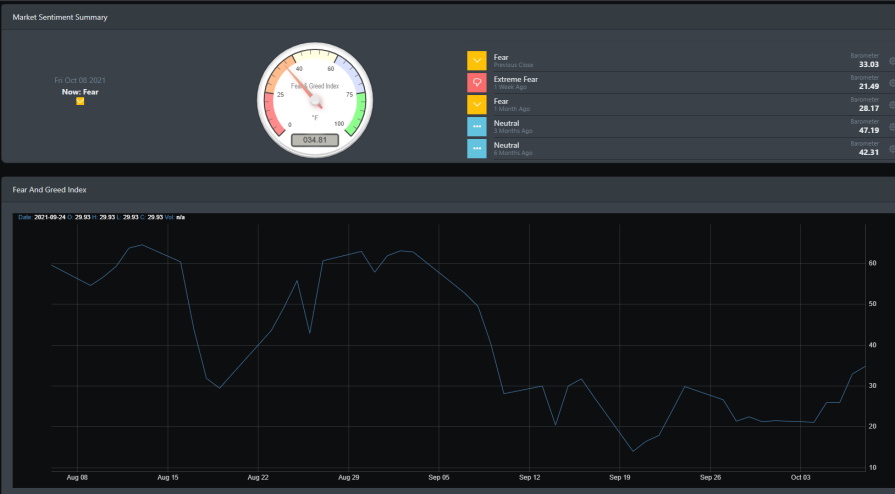
Market sentiment was in extreme fear for the 2nd half of September. Having reached a low of 14.03 (lowest this year was set on 4/20/21 with a reading of 11.90) on September 20, sentiment looks to have bottom and is now on the rise. The last few trading sessions have suggested that sentiment is changing and could be a potential for a near-term rally.
Economic Outlook
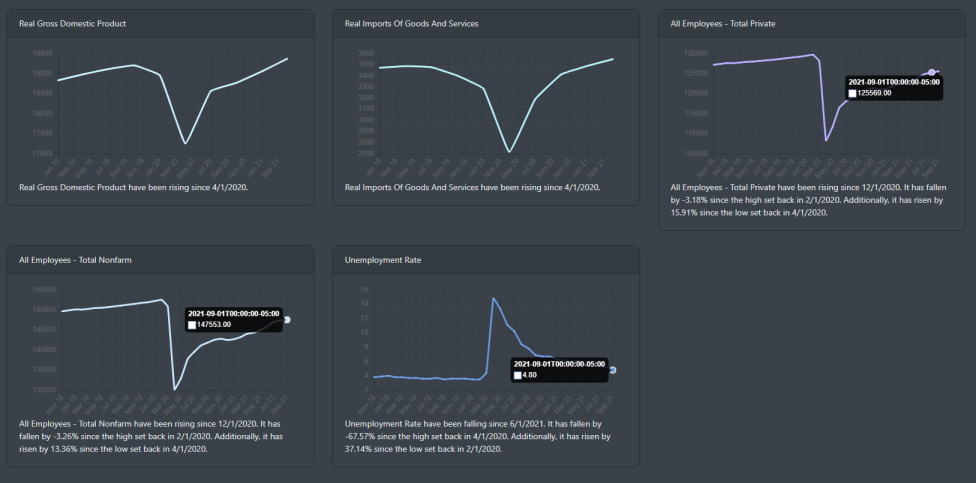
As we discussed in several of our blogs for this year, the overall macroeconomic data is positive. Supply chain issues still are problematic on both the domestic and international front where lead times can be anywhere from 2 to 6 weeks out. For this week, we focus on the employment report that was released on Friday. You can find that report here.
Looking at the chart below, it is clear the labor market is trending higher. The unemployment rate for the month has dropped from 5.20 to 4.80. Additionally, claims dropped and are sitting at ~325K. Everything looks well but upon further inspection, the data shows a disappointing jobs report. The actual job growth was a big miss. With expectations and estimates of 500K, the total non-farm report came out at roughly 194,000.
Market Outlook
With Q3 earnings season ready to get underway, there is high optimism that the projected profit growth will help push the markets into rally mode. On the intermediate charts, the overall market indices are reading bearish. The major indices are moving lower and the technical readings on the weekly charts are modestly lower. Let's review the indices on the daily front.
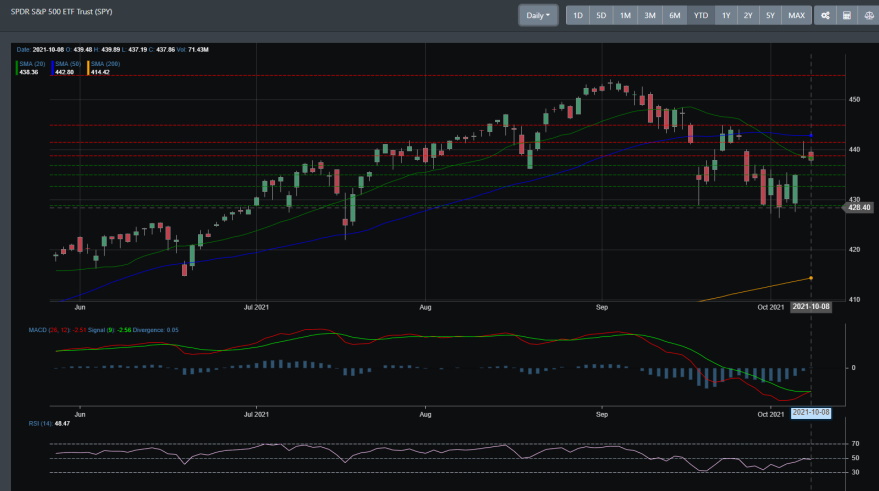
SPY
SPY has been trending lower since the start of September. It is right now on the 50 DMA where support is around 436 and resistance is shy above 441. The MACD indicator is in oversold territory and could signal a bullish crossover if SPY can maintain its support and push into its near-term resistance.
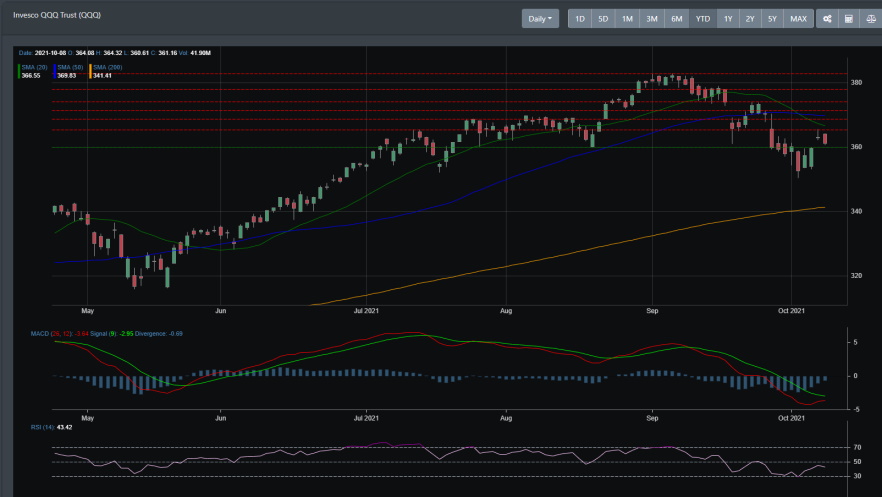
QQQ
QQQ has broken the trend and was moving lower until mid-week. The intermediate readings are quite bearish but it will re-test its 50 DMA resistance in the next few days. It is currently sitting right between support of 360 and resistance of 365. A bullish move would have it move through its near-term resistance and challenge the 50 DMA.
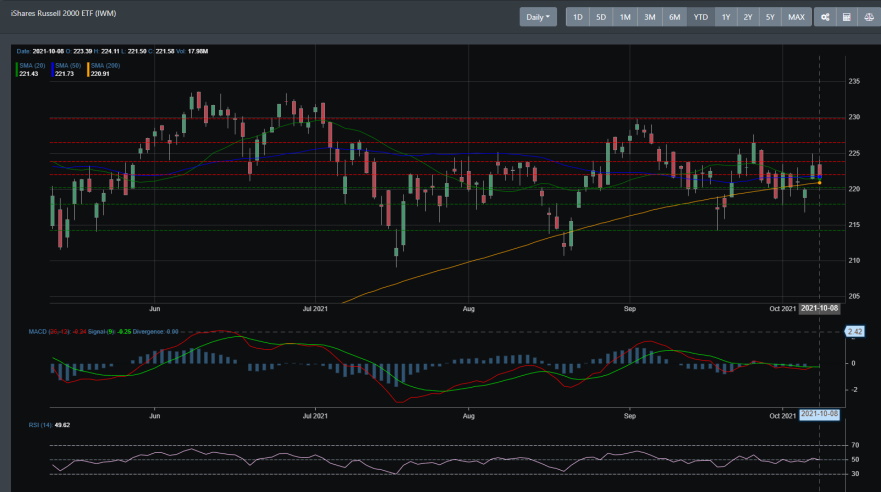
IWM
The Russell 2000 has been in ranging for much of 2021. Its consolidation phase started near the end of February and like SPY it is sitting on its 50 DMA line.
Concluding
Overall, markets have finally caught up with IWM and are now consolidating their gains. Will markets behave as they did in October 2020 and continue a consolidation pattern until breaking out in November 2020? There are definitely bearish readings on the technical front but as we mentioned earlier, the S&P 500 is only 3% below its all-time high. There has been no market correction or really a blip of a dip. Market news pundits would have you believe the sky is falling. And as we discussed in this article, there is a high probability for a near-term rally where we see a re-test of all-time highs. We will know sooner or later if markets will try that re-test or fall lower into the next underlying support.