


Super Bowl weekend is here but that excitement did not translate too much for the equity indexes this week. Only the Russell 2000 posted a positive gain for this week. Though it has been down -10% YTD, IWM was able to make a solid +1.3% gain to close out the week. The S&P 500 and Nasdaq felt the brunt on Friday as Facebook dropped on missed earnings. Markets are now in the "biggest" correction since the COVID drop in March 2020. While the S&P 500 has dropped more than -12%, the Nasdaq is in the bear territory with a 20% decline. Many companies have been hit hard with a drop of 30 to 50% decline and all of this has happened in January.
Big Picture
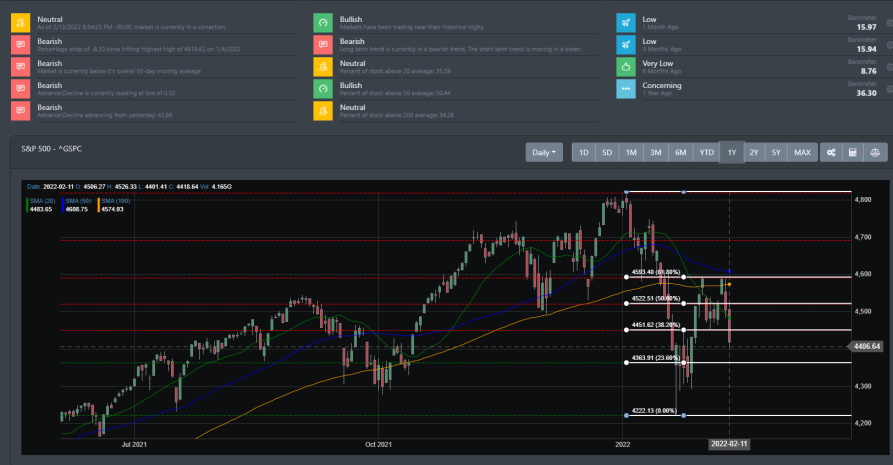
Markets did find their footing and started the week with a solid 2-day rally. The consecutive day rally pushed the indexes up to their first test of resistance. And as we discussed last week, we saw this as the first line of test for the bulls. The S&P 500 could not break the 4600 regions where the 50 DMA was sitting. For 2 weeks the S&P 500 tried to push higher through this region but the bears came in full force. Critical support is now at the 4300 regions for the S&P 500. The Nasdaq has experienced a deeper decline but has since found a bottom near the 13000 regions.
Market Breadth
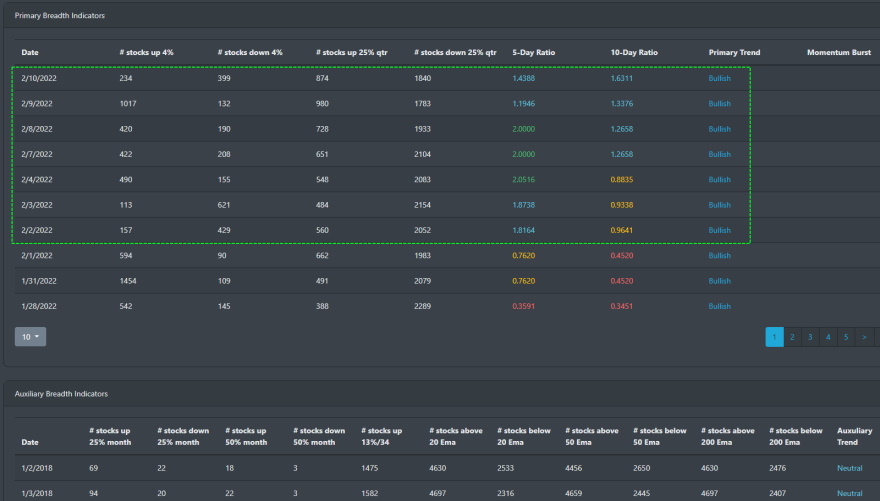
The past couple of weeks has been quite volatile for the equity markets. But if we look at the current market data picture, we are seeing a much more improved picture. For most of January, market breadth has been clearly bearish. The February data is starting to show improvements in momentum. Even with Thursday and Friday's negative days, momentum is starting to push in the positive direction.
Market Sentiment
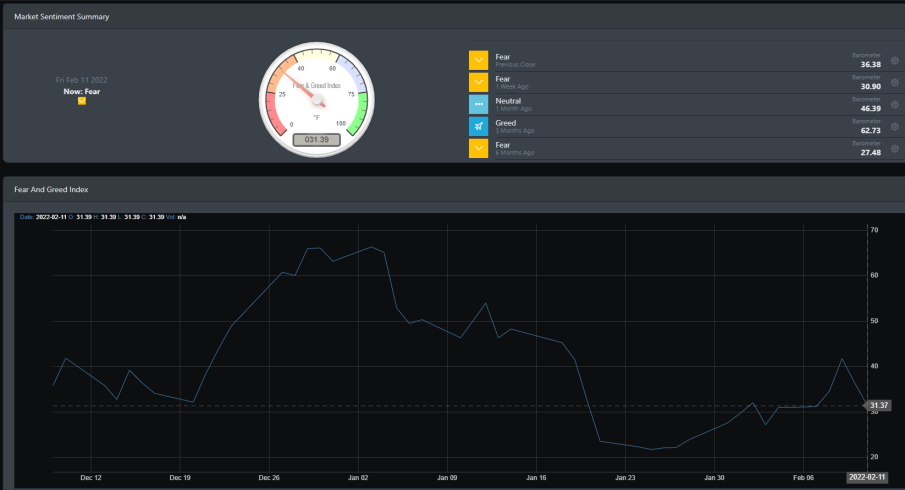
Market sentiment is still in fear mode and has been that way for most of 2022. However, sentiment has been slowly trending higher since bottoming out in late January.
Economic Outlook
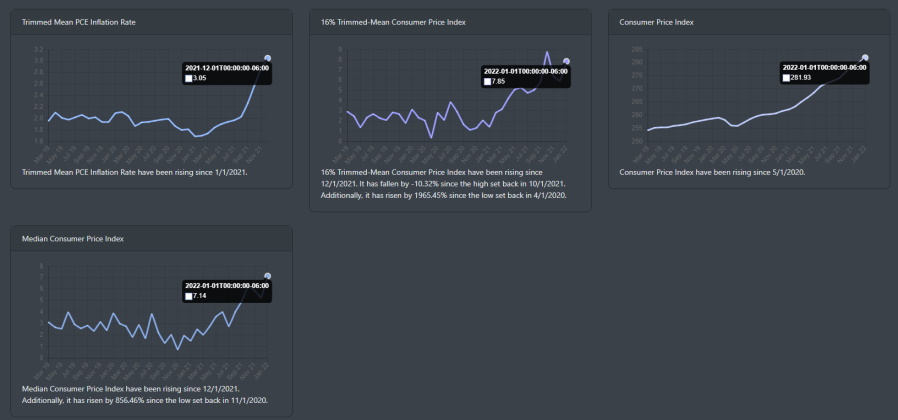
The Consumer Price Index(CPI) report came out for January this week where it falls short of original estimates of around 7%. However, it CPI is still running hot and did rise .6% in January. A lot of news has been pointing to the supply chain issue but there is also another issue at play here and that is the energy cost. Looking at some of the CPI data below, it is a possibility that an uptick could be a result of the winter storm hitting the U.S in January. Looking at the monthly averages, it is still clear that the overall CPI is rising.
With stimulus expiring, rising prices, COVID lockdowns, and Fed hike coming this year, growth for Q122 is stalling and will most likely trend lower.
Market Outlook
Stocks and bonds are all lower YTD. What is obvious is with the rise in the cost of energy, XLE (Energy) has been the winner for the start of 2022. Let's look at the ETF indexes YTD on the weekly timeframe.
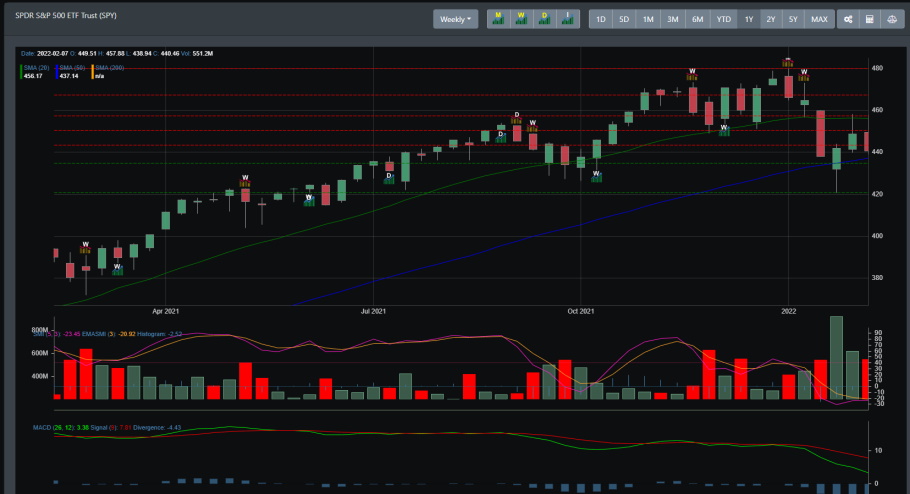
SPY
The weekly timeframe paints a very bearish picture. Having started in early January, the monthly and weekly trend is clearly in a downtrend. There was a short counter-rally but SPY was unable to push above its 50 DMA.
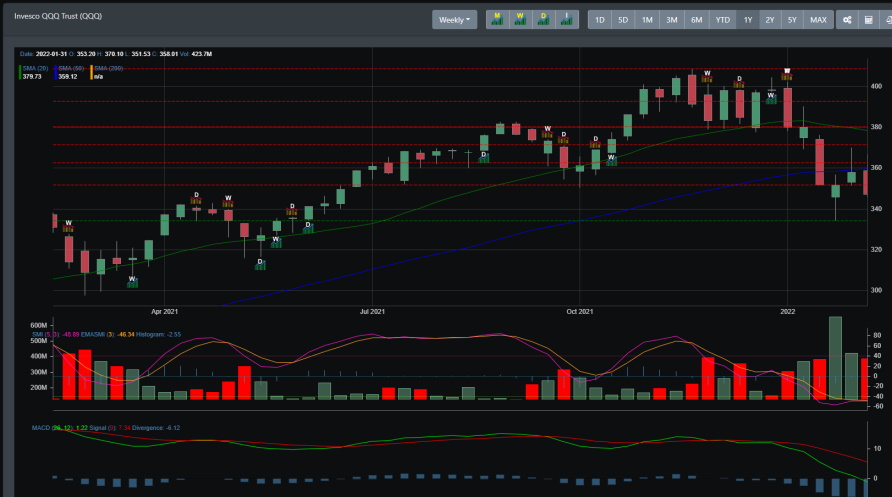
QQQ
Like SPY, QQQ weekly trend was broken in early January and has since been trending lower. Unlike SPY, QQQ is trending below its 200 DMA.
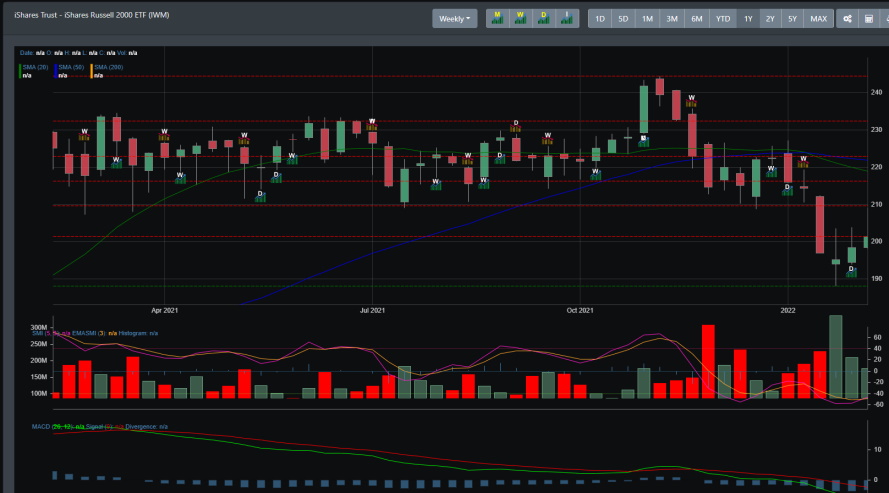
IWM
IWM weekly trend is lower as well. However, for the past couple of weeks, IWM is having a strong push high. You can see that with the last couple of weeks where it has been posting positive gains.
Concluding
The drop this week was not surprising. As we discussed last week, we mentioned how the upside to the recent rally was going to be tested this week. Additionally, we also mentioned last week that there was still a lot of downward pressure on the market. The re-test of the 50 DMA and downward pressure was too much for the bulls this week. However, with market breadth improving and the Russell 2000 looking to push higher, it could be enough to help the bulls re-test the 50DMA again.