


A new month and the start of a recent quarter set in for the markets. While August and September have closed out with consecutive monthly losses for every major index, this week's close gives pause to a sign that could spell troubles for the bears. While the narrative has not changed since last year when economists and market pundits were ready to claim that high rates would bring down the market, the market is significantly higher than when it was back in October 2022. Regardless, rates are higher now than they were a year ago. However, the bearish news has mostly stayed the same since our last call for a bottom setback in October 2022. The housing market is still in a situation where low supply, high prices, and ~7% on a 30-year mortgage have dampened demand. Meanwhile, consumer sentiment is near an all-time low. This bearish fundamental backdrop has yet to deter the strong rally we have seen leading into the summer of 2023.
Big Picture
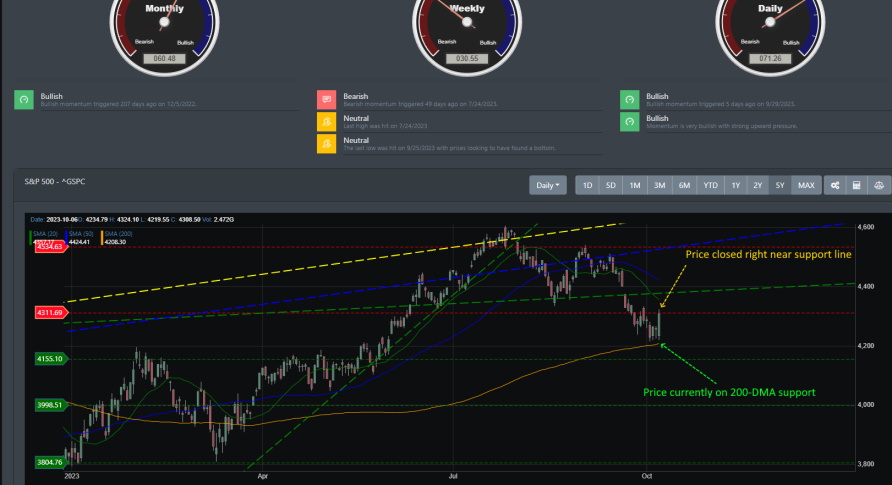
This week, the S&P 500 made a lower low at the 4216 area. This region is near where we started in our previous blog as an important critical support region. Here is our concluding comment from our last blog:
Resistance is at the 4534 region. Support is at the 4311 region. With Friday's price action, there is a high probability that we will see markets move lower to challenge support. This will play out in the next few weeks, and if prices can hold onto support, we can see the rally continue and challenge its all-time highs before year's end. However, breaking the 4311 region can close the door to that notion. If support does not hold then the next near-term support is right where there was a gap up in 6/1/23. Support at at this point will be around ~4221.
Price did drop that week following our blog, and it initially did settle on initial support at around ~4311. However, as stated in the above comments, if the 4311 support could not hold, we expected the next immediate support to be near the 4221 region. And here we are now with the S&P 500 hitting that region at 4216. The bulls were prepared to keep prices above support and over the 200 DMA as Friday's reversal allowed markets to close above the initial support region.
Market Breadth
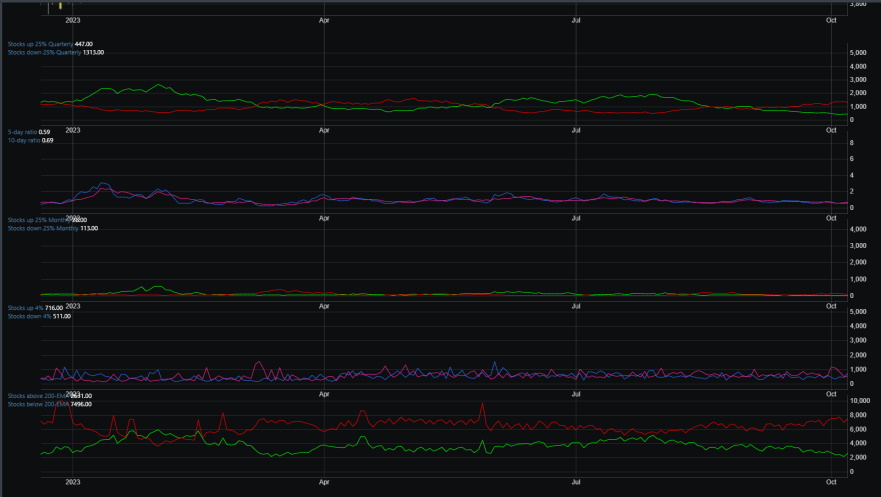
Market breadth has been bearish since the intermediate bearish crossover on 9/16/23. However, prices have staggered lowered in a regimented fashion, and market breadth has started to settle this week. Though the percentage of stocks above and below their 200 EMA are correct at levels we have seen before the October 2022 reversal, the near-term readings of stocks up and down 4% are starting to turn bullish. This is nearly identical to the pattern we saw during late October 2022 when markets started pushing higher.
Market Sentiment
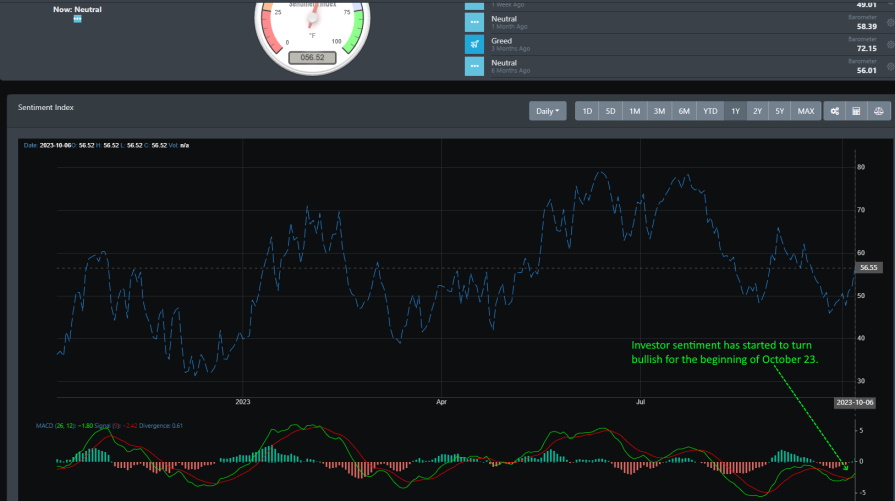
Market sentiment has taken a nose dive since hitting their highs in the summer of 2023. And as we stated back during that period, it was only a matter of time before we saw sentiment perform a reversion to the mean. Right now, the sentiment is neutral, but the MACD is signaling a bullish convergence that may signal a reversal is forming.
Market Outlook
All major indices are at key support levels. IWM will be a crucial key player in how markets navigate this quarter. The SPY and QQQ rebounded from pre-market declines on Friday to spell off major topping for the needs. However, everything is not so rosy, as all major indices are now in a downtrend on multiple timeframes.
SPY
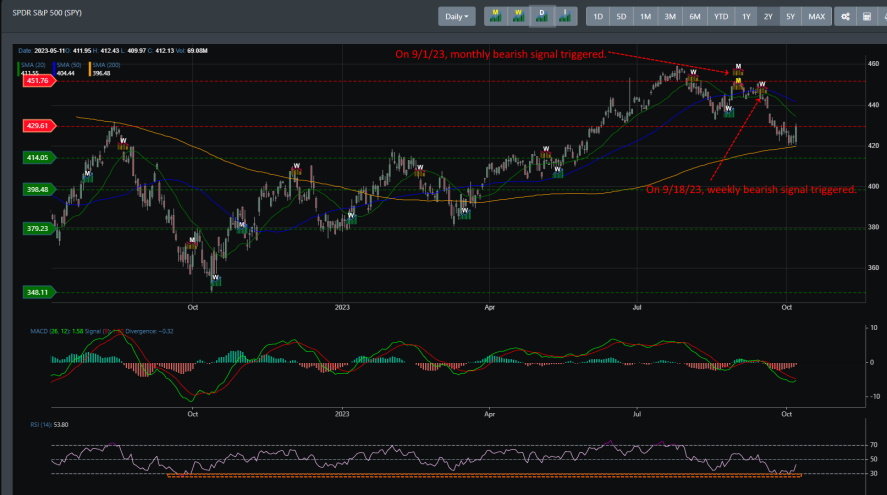
SPY is now in both a monthly and weekly bearish trend. The Monthly bearish signal was triggered on 9/1/23, followed by the weekly. On Friday, SPY was able to hang above its 200 DMA and close right under resistance near the 429 region.
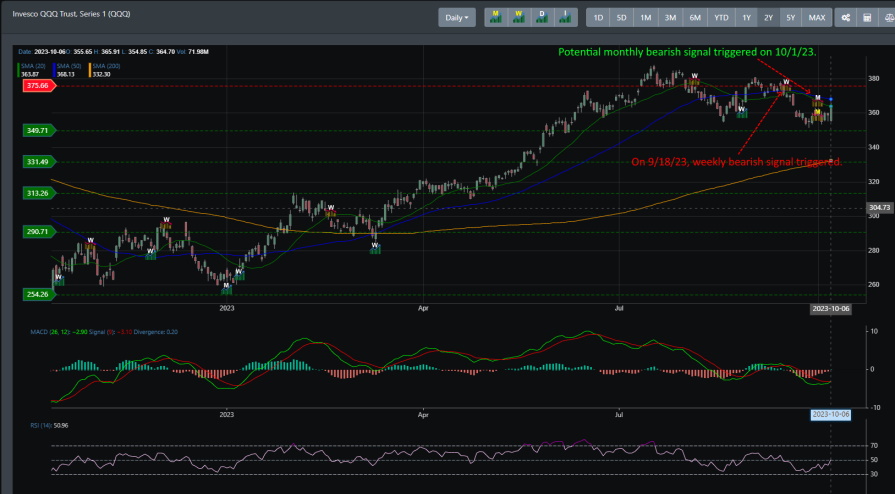
QQQ
QQQ is in a weekly bearish trend, but only recently has it received its monthly bearish signal. The monthly bearish signal is a potential signal triggered at the start of October. Like SPY, it also reversed the upside to close out Friday's trading session. Though QQQ is in a weekly bearish signal, it is still well above its 200 DMA and just right under its 50 DMA.
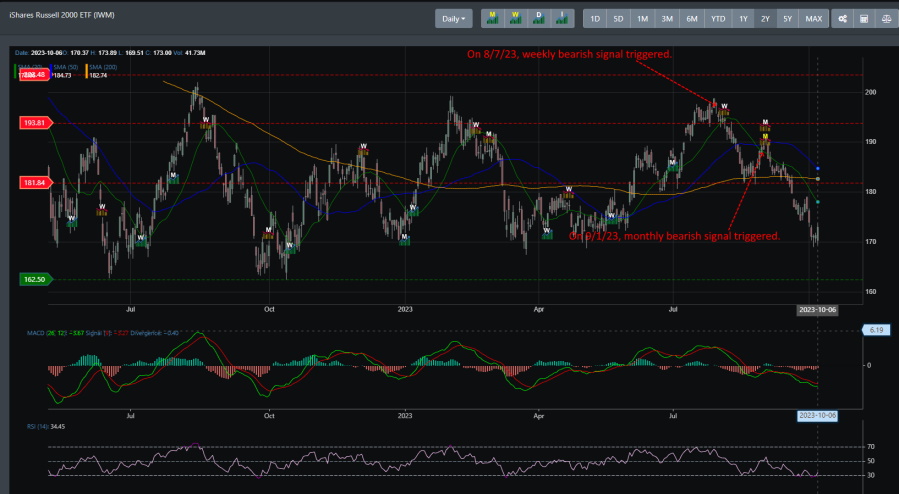
IWM
Since hitting its weekly and bearish signal in August and September, IWM has moved lower to almost challenge its low setback in October 2022. If there is ever a key indicator to watch, it is IWM. If IWM cannot hold onto support and breaks support at 162.50, then there is a high probability that the rally that started in October 2022 has topped out. With Friday's strong close, IWM is still above that support region.
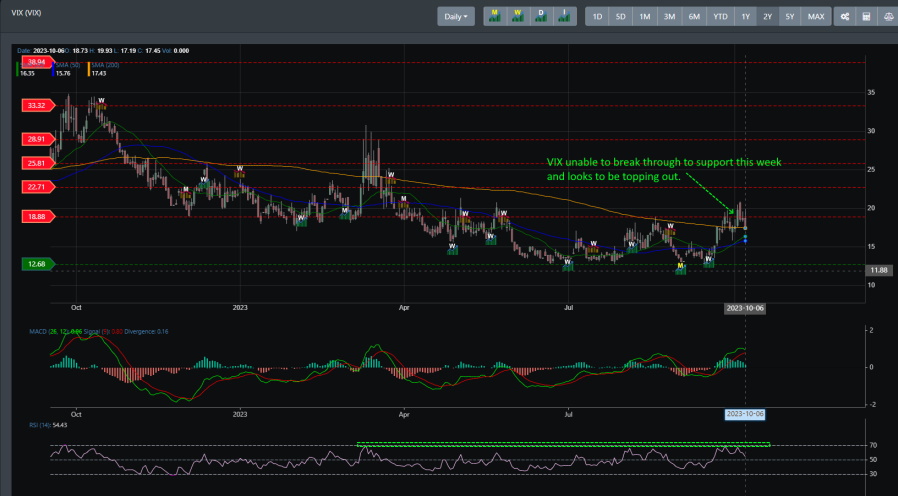
VIX
When VIX received a monthly bullish signal on 9/1/22 and its weekly bullish signal on 9/18/22, it strongly indicated that markets would have a pullback. However, VIX has now hit resistance near the 18.88 area, and this has been a problematic resistance level to break through. Looking at the chart, there are three major inflection points where VIX was not able to break through this resistance area and markets were able to rally right off of that. There is a high probability that we are seeing that happening now.
Concluding
the Big Picture section, there is a crucial resistance line that markets must break through. That resistance area is near the 4534 region. Currently, markets are just trying to hold onto support at the 4311 area. If, in the coming weeks, markets can maintain support at the 4311 region and rally above it, there is a high potential for markets to challenge resistance at 4534. If 4534 is broken to the upside, we may see a likelihood of markets challenging the previous highs set back in January 2022