


Wall Street was feeling the squeeze this week when traders at Wall Street Bets successfully organized a short-squeeze which has left many traders with paper-rich shares. Now, with brokerage firms like Robinhood restricting trading in heavily shorted stocks (GameStop), it is now a question of not when but who will they be able to sell to. Hedge funds like Melvin Capital who were caught in the short squeeze were forced to cover their short positions. This caused GameStop (the poster child for retail trader rebellion) and a handful of other shorted stocks to skyrocket. Right now, the GameStop price movement is driven by speculation and investor rebellion. Let's be real - GameStop is a zombie retailer that typically has been left for dead. The only reason anyone is buying the stock now is due to the short-squeeze condition that is currently in play.
As for the market, the S&P was down around 3.3%. Overall, it was a bad week with 3 out of the 5 trading days being negative. As we discussed in our prior blogs, the market is still overbought and overstretched. According to Advisor Perspective - Is the Market Still overvalued? markets are 170% over their long term mean. Historically, this is higher than the bubble of 2000. All this means is that even with the current correction that is occurring, this is the most over-stretched market in history.
Big Picture
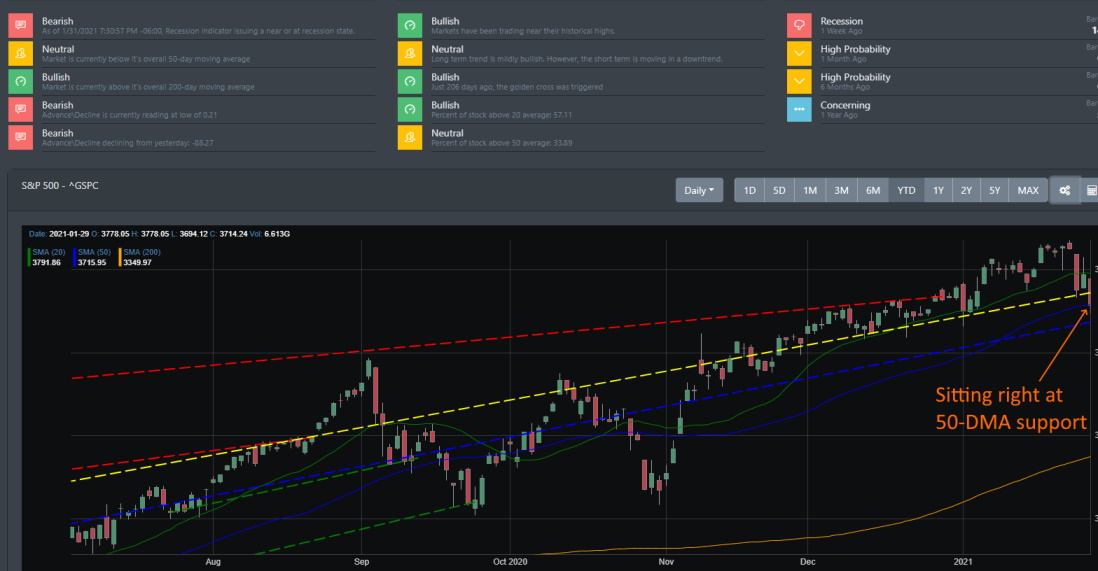
A correction is currently hitting the market right now. Right now, this looks to be a short-term correction of about 3% to 5%. Recall, that market corrections are natural and healthy to the market. For the S&P 500, it broke down through the 20DMA and BullGap's median trend line this week. It is currently hovering right about the 50-DMA. Right now, there is selling pressure in the market with money flow dropping. If the price drops below the blue trend line, it could mean a more severe correction that is occurring in the market. For now, this looks more like profit-taking after a huge rally.
Market Breadth
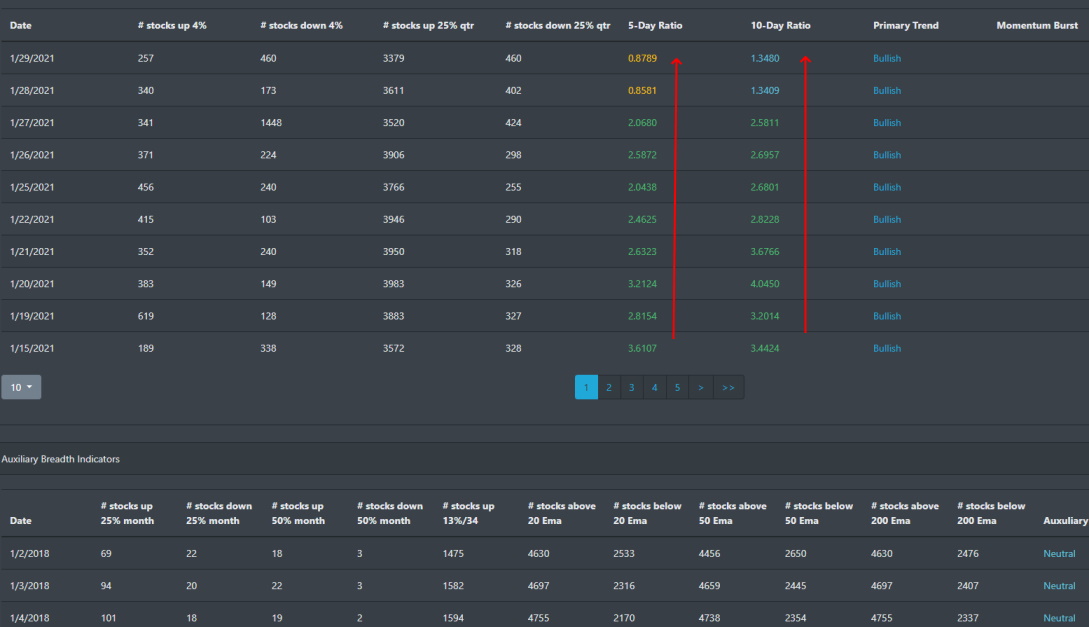
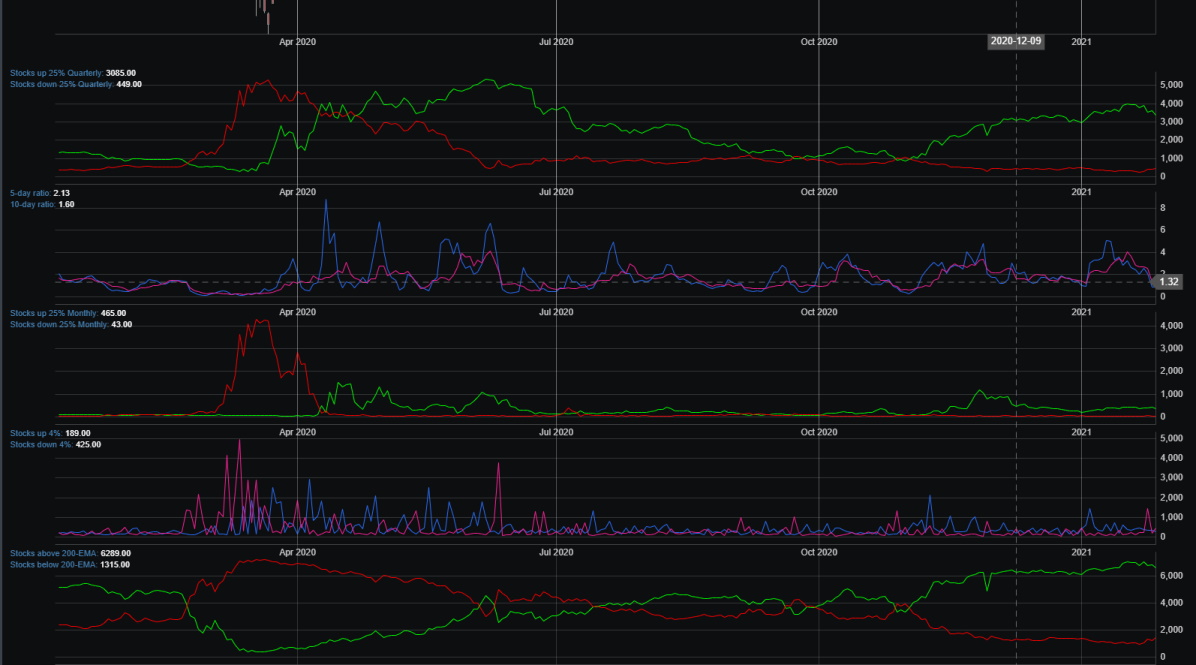
Right around 1/21, you can start to see market breadth deteriorating. The number of stocks up by 4% was reaching high numbers right up to that point. When the 10-day ratio dips under 2, we see that as a short-term bearish signal.
Even with the current market correction, there is still a historically large percentage of stocks above their 200-EMA. A decade of Fed policy of injecting liquidity into the financial markets has every investor believing that the Feds will come to the rescue to reduce risk. That has been such the case as evident in every dip-buying that has occurred during market corrections for the past decade.
Market Sentiment
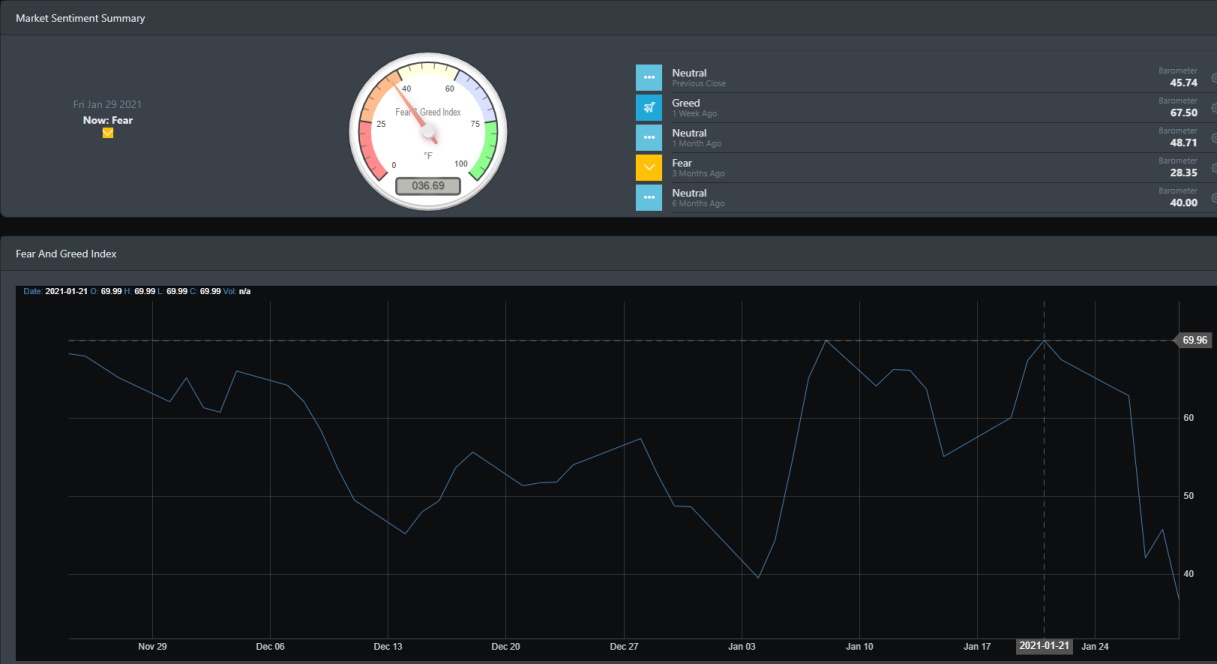
The rampant speculation in the market is right now hovering over extreme levels. As we discussed a few times in prior blogs, when our Market sentiment index hits extreme levels of +65, there is typically a market correction that follows suit. This occurred right on cue on 1/21.
Economic Outlook
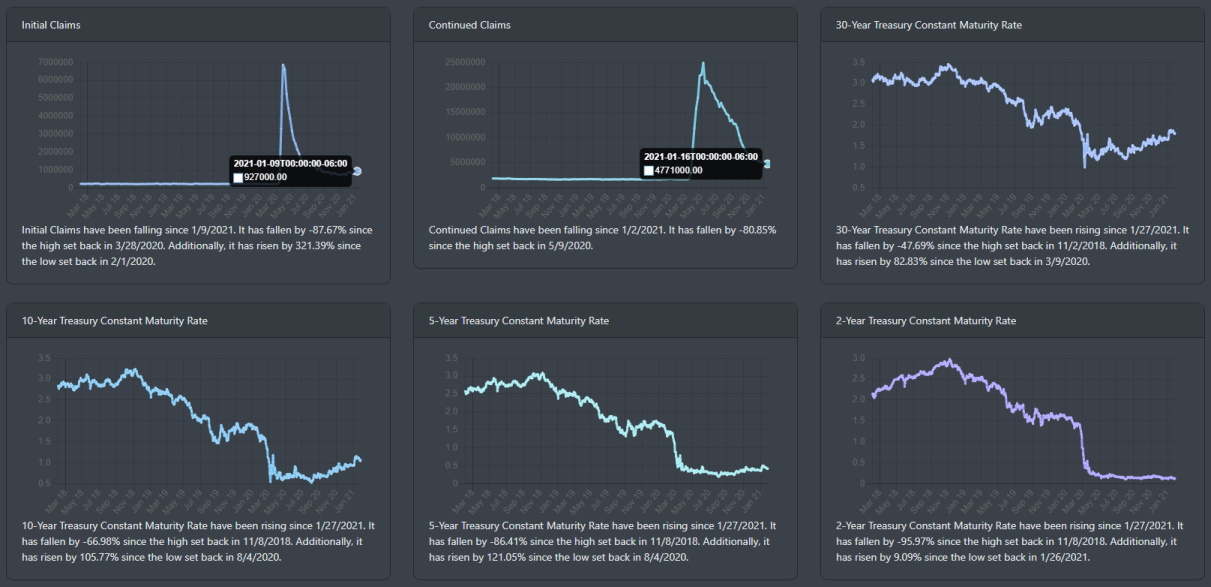
From the data, growth is slowing down and will likely continue to struggle for the next couple of months. The BEA report on Personal Income shows that in December Disposable personal income (DPI) and increased by 0.6% while personal consumption expenditures (PCE) decreased by 0.2%. Expectations are hopefully with the increase in the vaccination rollout and increase in household cash, the reopening of the economy will see growth continue into the middle part of 2021.
Jobless claims declined by over 100,000 and the weekly claims have been above 900,00 for several weeks. Since the start of the pandemic, claims have oscillated between 50,000 to 100,000 per week. Typically, claims have a range of 20,000 or less. With the January job report coming out soon, it is highly likely that it will be negative.
Market Outlook
Stocks have so far reported good earnings. However, the good earning reports are seeing a price drop for many of the stocks. Whether this is profit taking or simply the fact that there is more supply than demand, the answer could be that stocks are right now just highly overvalued.
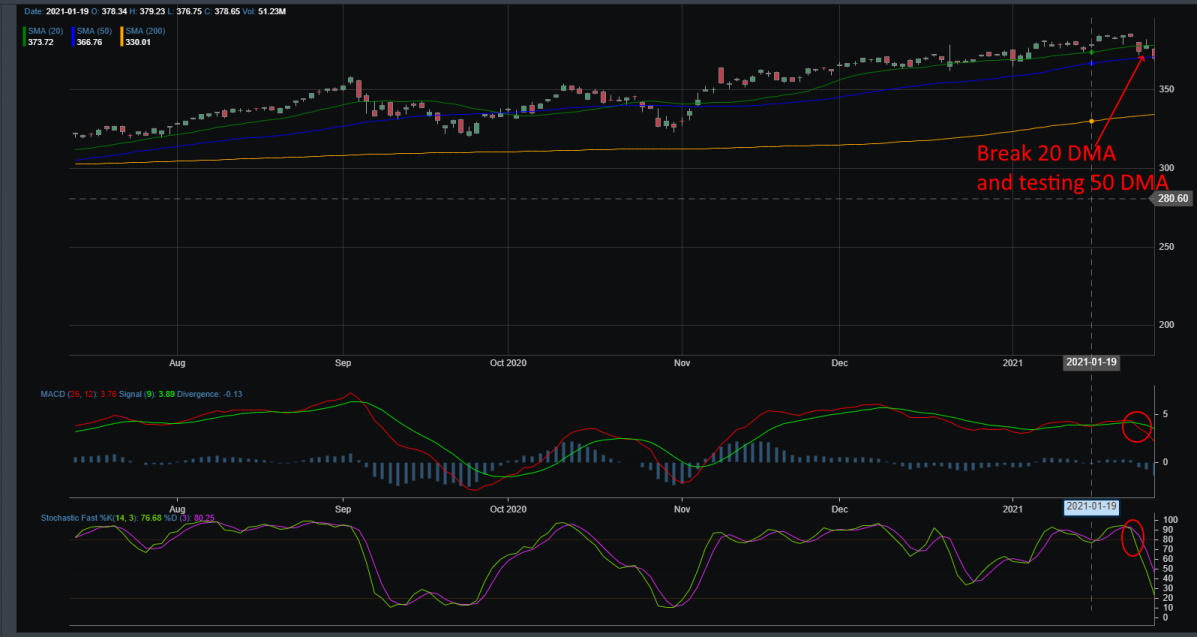
SPY
Looking at the DAILY chart below, we see several bearish signals. The MACD issued a sell signal this week, SPY dropped below the 20 DMA and is now at the 50 DMA, Stochastic readings are dropping to bearish supply.
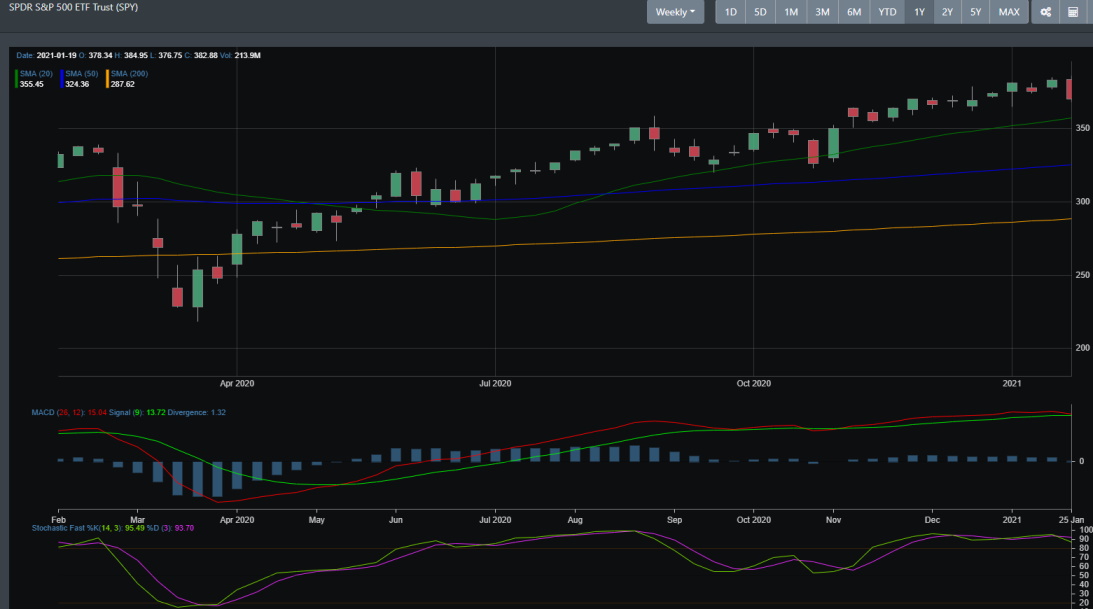
Weekly SPY chart
The weekly chart gives more perspective on what is currently occurring in the market. After more than 10 weeks of moving higher, a pullback just occurred. The MACD is issuing the start of a weekly sell signal and the stochastic reading just had a cross over this week. You can take note that this occurred also in October as markets digested and then turned up.
Concluding
Markets have been on a tear for more than 10 weeks and right now a market correction is welcome. As noted earlier, market corrections are healthy for the bull market as it allows for the overbought conditions to normalize. From looking at the technical readings, this correction looks to be a normal pullback. There is a high probability that there will be a reflexive rally this week but expect the market to move lower for a few weeks.