


The S&P continues its march to all-time highs. Back in December, we discussed the high probability that the S&P 500 would ascend into the 4000 marker. That trajectory came into fruition last week. But you as an investor may have missed it because you were busy listening to all the news regarding a market bubble, massive correction coming, rising inflation, rotational trades.
We get it. Investors have a lot of information to process when it comes to the financial markets. There is a camp that proactively follows every news outlet and talking bubbleheads to try to understand where the market is headed next. And there is another camp that dismisses the unfounded claims of market bubbles and bear markets and looks at the improving earnings report, economic data, and renewed confidence in the economy. Are you right now in the throws of daily market events that oscillate between good and bad news? Are you waiting on the sidelines to see if the market will drop? Or are you a believer that we are still in a secular bull market?
Well, if you were the investor who kept money on the sidelines, then chances are you missed out on all major indexes pushing to all-time highs. The investor who subscribed to the latter has been the clear winner and continues to profit.
Big Picture
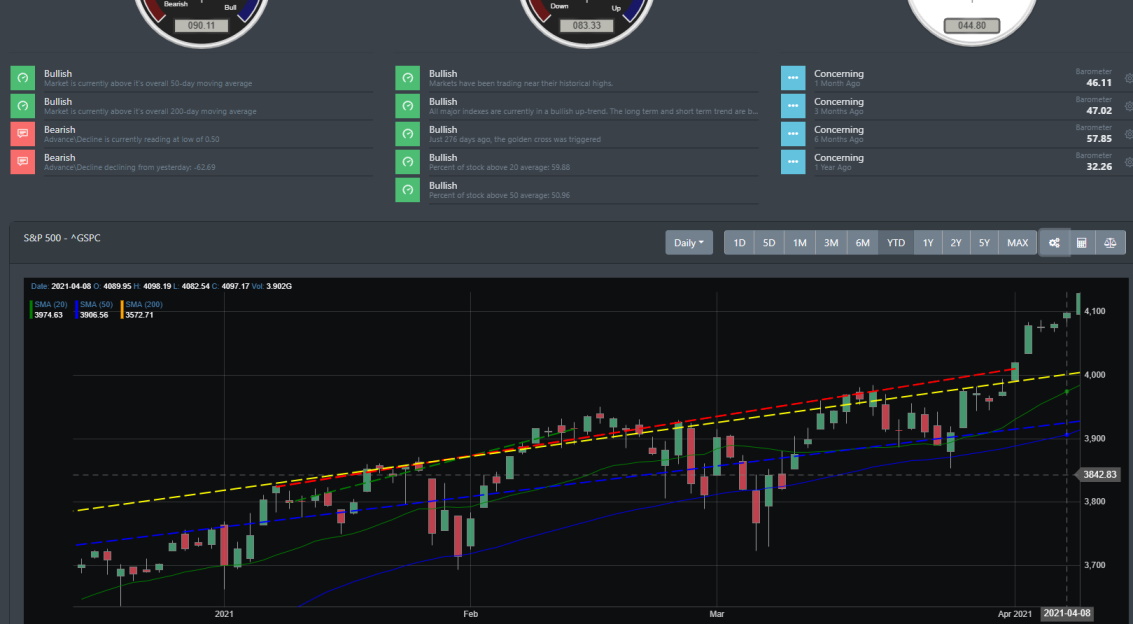
The chart below pretty much sums up the week. Market meltup! When markets were correcting and consolidating in March, there were those that were calling for a major correction. Anyone who sold out at that point surely missed the fact that the S&P 500 is now up +6.5 from last month.
There is no bearish price action here folks. The S&P gapped up, consolidated, and pushed higher to end the week at 4129. With the new breakout and broad market strength, we are seeing a meltup that has a high likelyhood of surpassing the 4300-4400 marker.
Market Breadth Table
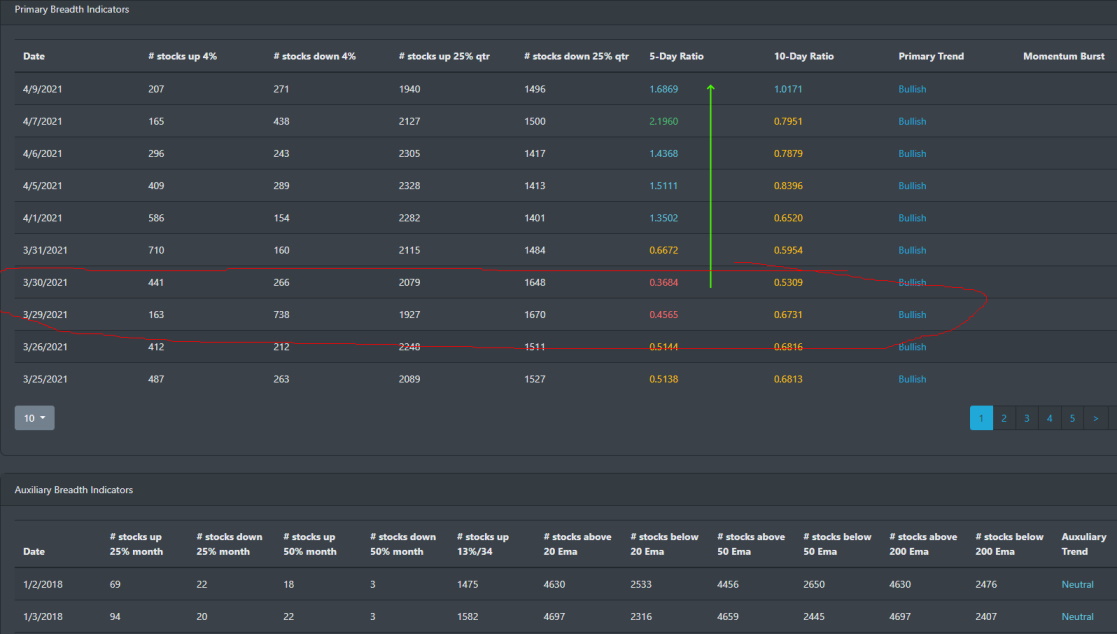
Strength begets strength and we are clearly seeing it here as market participants buy into the market. From the table below, markets hit a bottom around late March and right now are poised to move higher. From this vantage point, there is no market bubble on this table view. Markets still have a way to move up. The 10-day ratio has not even triggered the 2.0 ratio where we normally call out a bullish momentum burst.
Market Breadth Chart
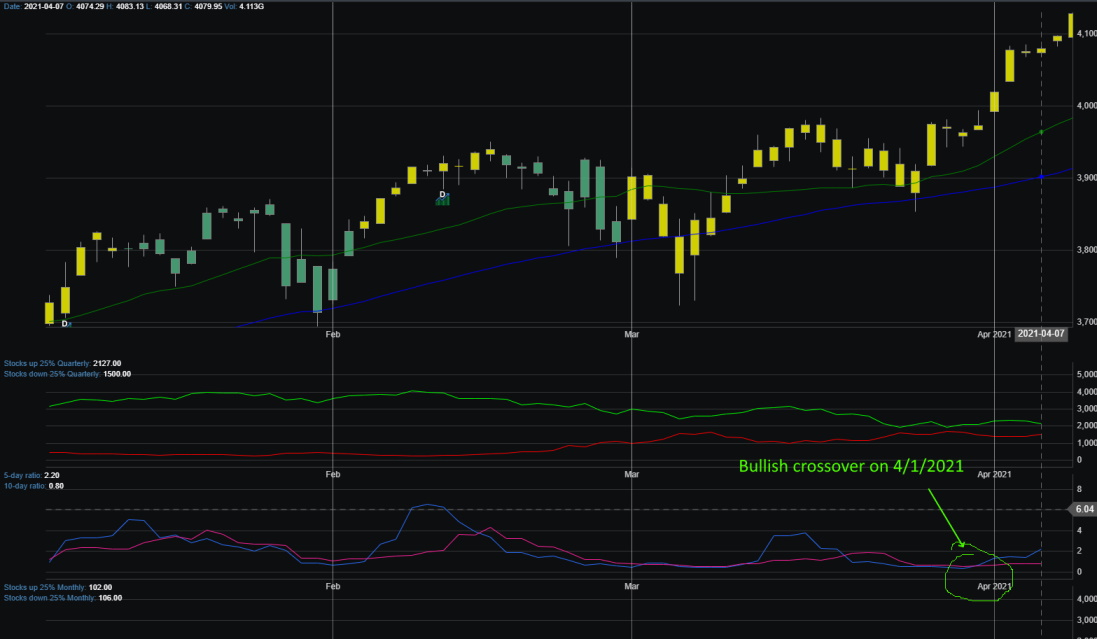
We can see right on 4/1/2021 where the 5-day ratio finally broke through and crossed over. Historically, when the 5-day ratio crosses over the 10-day ratio, it signifies ample market participation in a bullish manner.
Market Sentiment
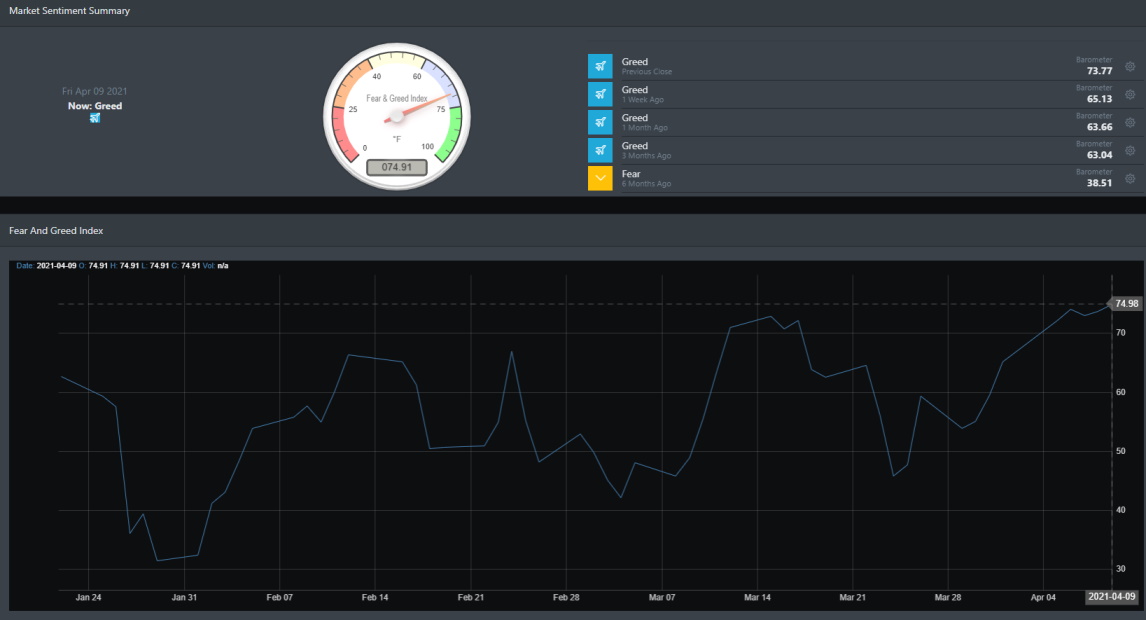
Market sentiment is currently at 74.91 and at an all-time high for the year. The last recent high was back in mid-March and what historically occurs when BullGap's sentiment index hits an all-time high is a slow down in the market. A consolidation period before the next move higher. We can see this play out with the chart below as markets consolidated after 3/15 and then rallied back up to hit another all-time high on Friday 4/9. There is a high probability that markets consolidate this coming week but with so much exuberance there is also a likelihood that the index hits another high.
Economic Outlook
Leading indicators are very positive with the housing market being a clear winner. Historical low rates have driven the housing market to new highs. Only recently with rising rates have we seen a dip in January. But historically, the housing market is on a solid front. Average weekly hours for workers are above pre-pandemic levels. And manufacturing new orders are all performing well for the year.
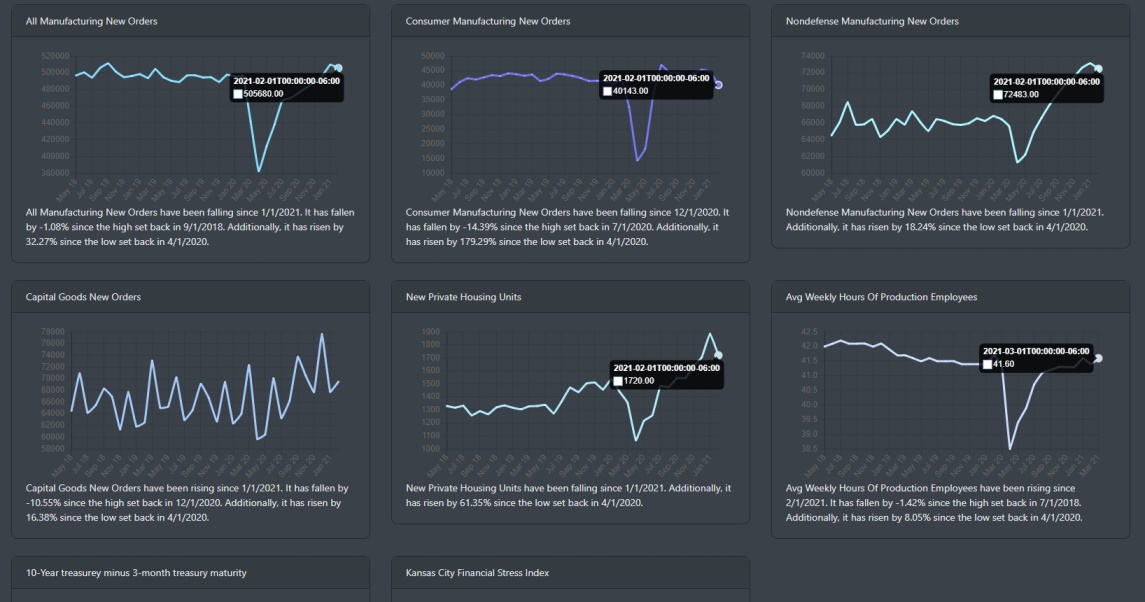
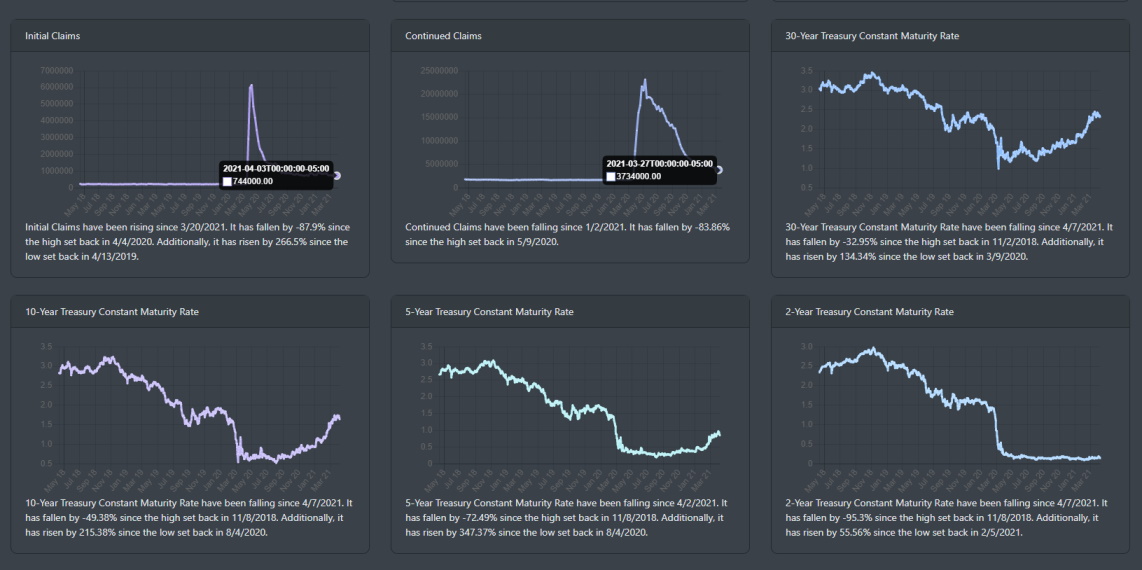
The outlier still sits with the labor market. Initial and continued claims is still at historical highs. With further re-opening of the economy, we hope to see this change course.
Market Outlook
For this week, let's look at the market from the weekly timeframe.
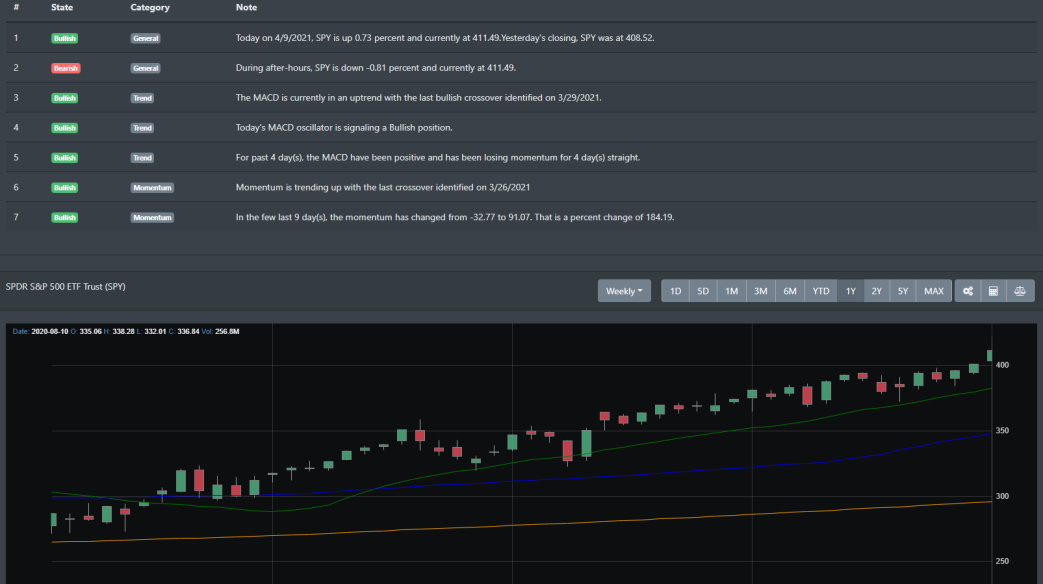
SPY
SPY on the weekly chart had a breakout for the week. It is clearly in an uptrend with price closing on Friday well above its 50-DMA. All weekly and daily technical indicators are quite bullish.
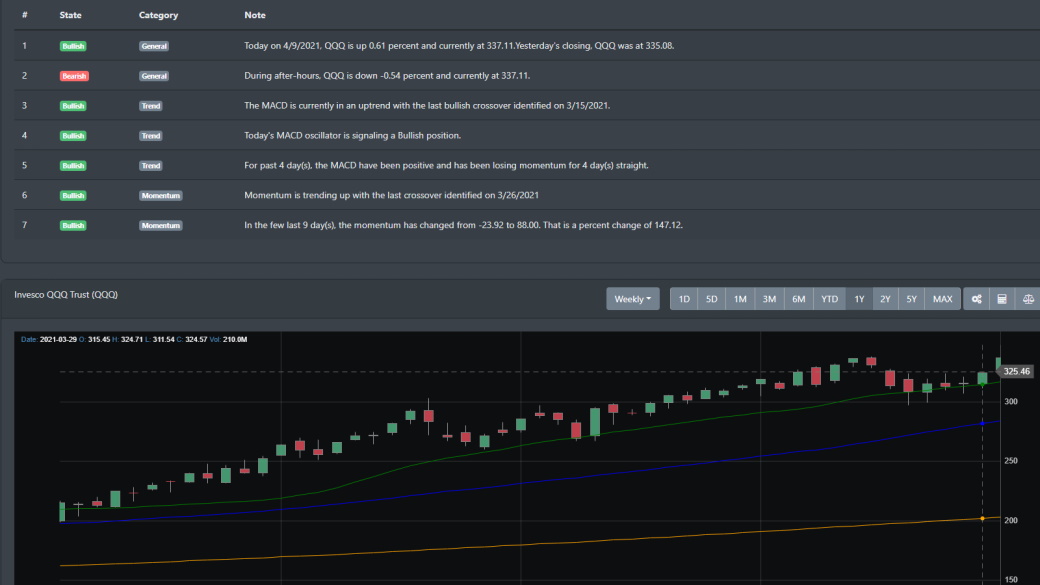
QQQ
QQQ has been consolidating for the better part of last March and found itself testing support on the 50-DMA. However, in April it has been quite bullish with increased volume. QQQ was one of the major winners last year where it gained over 145% from March 20 lows.
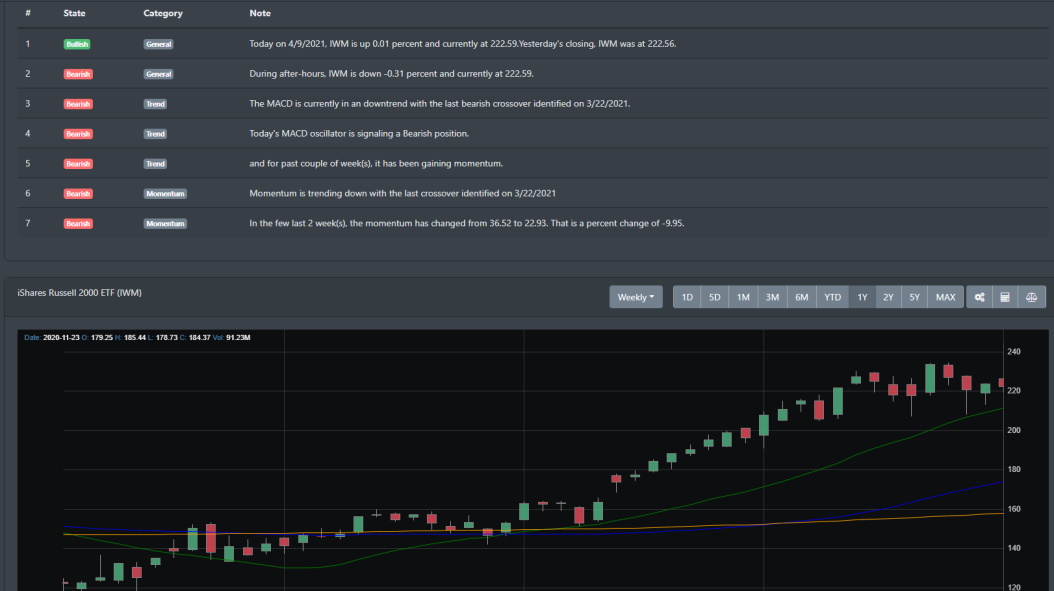
IWM
Small caps also were one of the darlings from last year. It has rallied over 100% since last March 20. As of recently, IWM has been in a consolidation pattern since February of this year.
Concluding
This coming week will kick off Q1 earnings season with major banks to start the first round of reporting. There is ample upside to Q1 earnings that is slated for the coming month. This though is yet another item that an investor must take in. With all the noise surrounding trade rotation where a sector is hot one week and then cold the next, investors have a lot to deal with on their plate. Recently, value dominated growth as the place to be and we could see that play out in the Nasdaq where it had a recent correction. With last week, it looks like tech is the best performing sector in the S&P 500.
In either case, you as an investor must decide what is newsworthy and if its narrative fits your rationale for why the market moves the way they do. However, with many news pundits calling out a market bubble