


A year ago from today, you would be hard-pressed to find an economist who doubted the U.S. was headed into a deep recession. With the housing market dropping and the Feds attempting to fight inflation by raising interest rates, economists and financial pundits were sure that the consumer market, other industry sectors, and the job market would come crashing down. Fast forward to today, and we have a robust job market (3.8% unemployment), strong 2Q earning reports, high demand for travel/entertainment, and resilient consumer spending that has all but many economists now calling for a soft landing.
But as the the phrase says, "The stock market is not the economy", we say stocks enter a bearish phase for most of 2022. And it was only on October 22, when many market pundits were sure markets would head lower, that we called out that markets were due for a move higher.
Big Picture
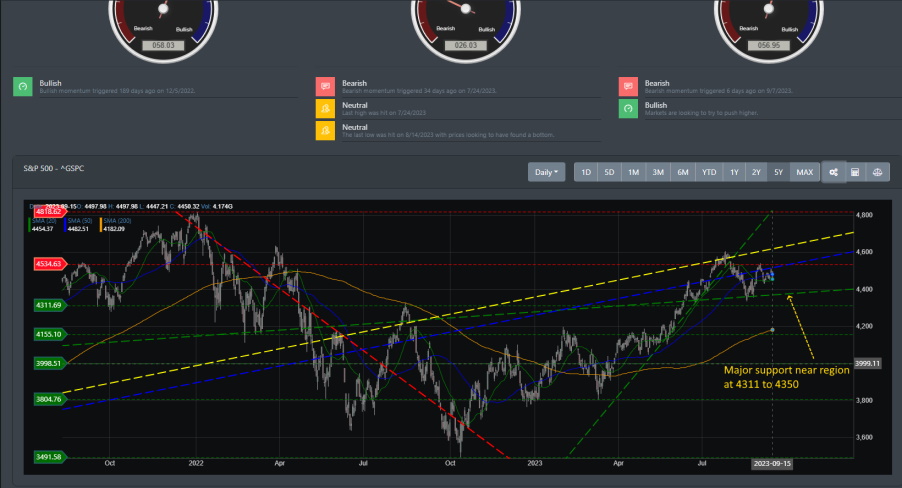
U.S. indexes, mainly the S&P 500, have been in a tight trading range for the past few weeks. With Friday's move, there is a strong indication that markets are gearing up for a move lower. However, the decline has been controlled and shallow despite the current pullback. For August alone, the pullback has been less than 5%, less than half of what you see in a withdrawal during the summer months.
However, the chart below clearly shows that the S&P 500 has trouble breaking through resistance near the 4534 region. A short-term rally occurred right after prices bounced off support right in the upper region 4311. With Fridays' price action, there is potential for markets to rechallenge support in the coming weeks.
Market Breadth
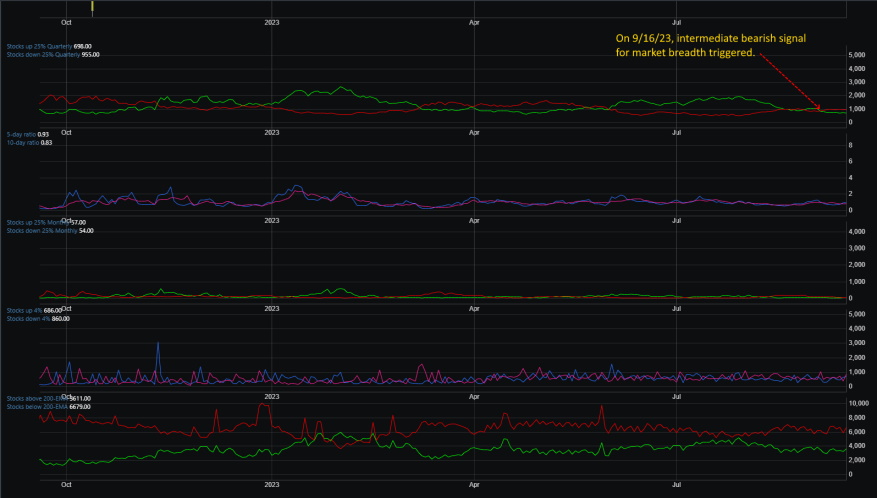
Market breadth improved significantly over the summer months, but as we started heading into September, we saw one of our bearish signals trigger. On 9/6/23, the stocks up and down 25% quarterly, crossed over to the bearish side. Historically, when this signal triggers bullish or bearish, it provides a very accurate reading of how markets behave over weeks and months.
Market Sentiment
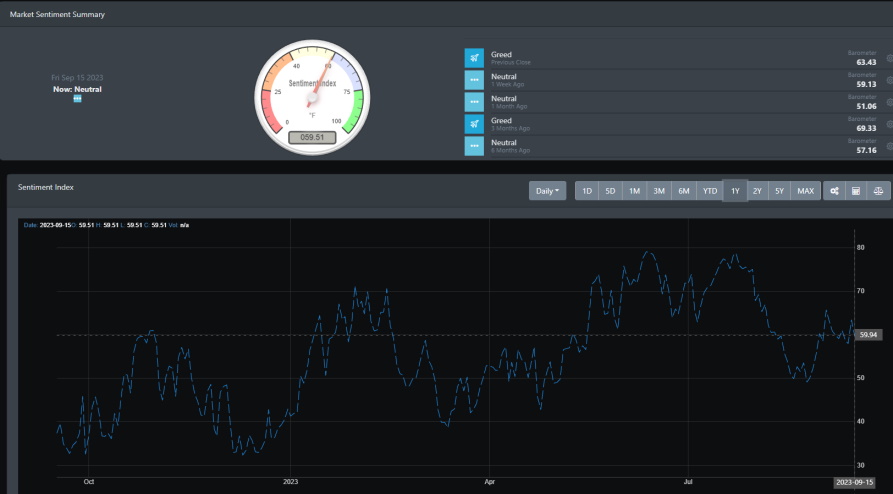
Markets have been range-bound for the past three weeks, clearly reflected in our market sentiment reading. Market readings have been neutral for the past month, suggesting investors are unsure where markets will head. Though there was a bounce earlier this month, bullish sentiment has dropped considerably since the highs in July. If we look at the weekly time frame, bullish sentiment seems to stall, and there may be a potential for sentiment to move lower in the coming weeks.
Market Outlook
The current pullback has been textbook, with markets moving lower to hit support and rallying higher to bounce off support. Nothing has changed much for the past three weeks as the bulls and bears are trying to determine if markets will head lower or higher in the coming weeks. While many wonder what the next move will be for the markets, let's look at the weekly timeframe to see if they provide a bigger picture of market direction.
SPY
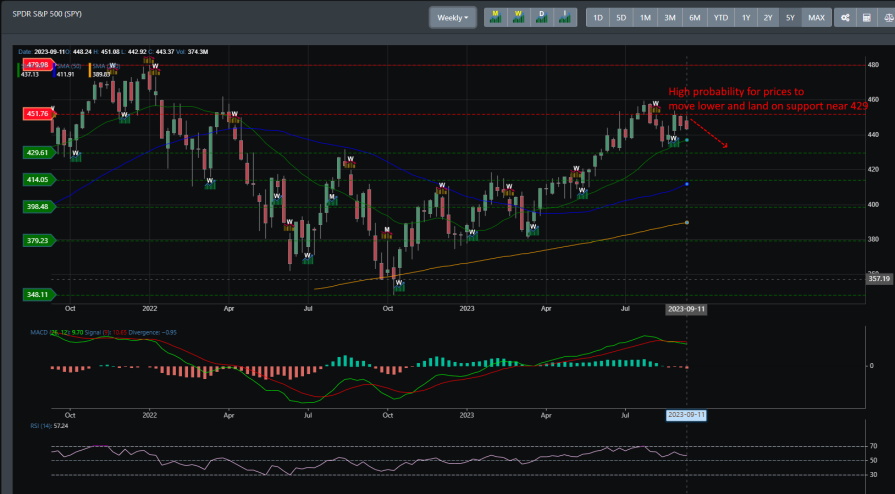
Looking at the weekly time frame for SPY, the technical picture would suggest that a move lower in the coming weeks is the most likely route. Having rallied recently and failing to break resistance near the 451 region, SPY looks like it will trend lower and challenge support near the 429 region. Though it is still within the confines of a weekly bullish signal, the past two trading sessions indicate that we may see a weekly bearish signal triggering.
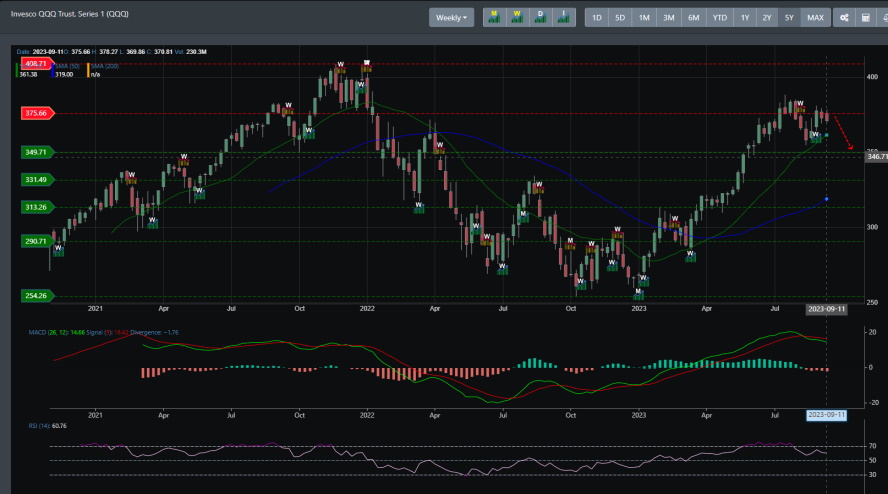
QQQ
QQQ mirrors SPY's price action movement. The weekly price movements also show prices failing to break resistance near the 375 region, and the technical picture is already painting a picture of a move lower to support near the 349 region.
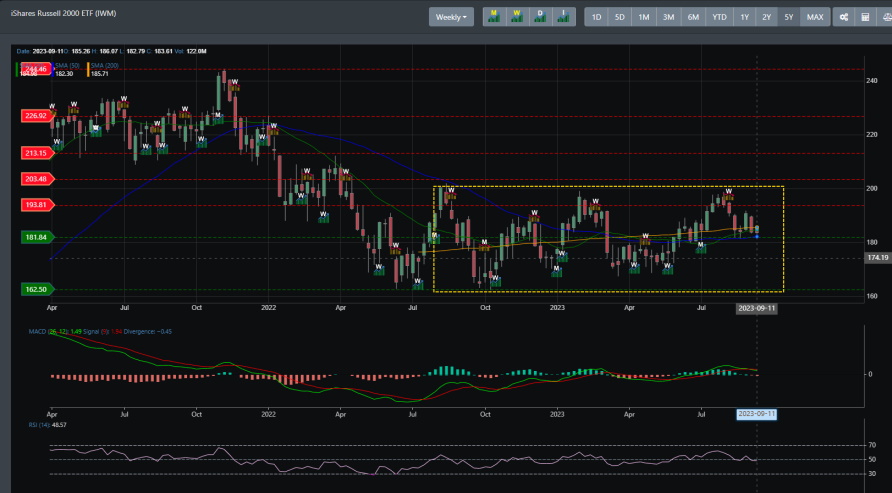
IWM
IWM has been in a trading range for a year now. In the chart below, we outlined in the yellow dash box the trading range for IWM. The weekly bearish signal has already been triggered for IWM, and prices are currently at support near the 181 region. If prices break further, we may see the overall market gaping lower.
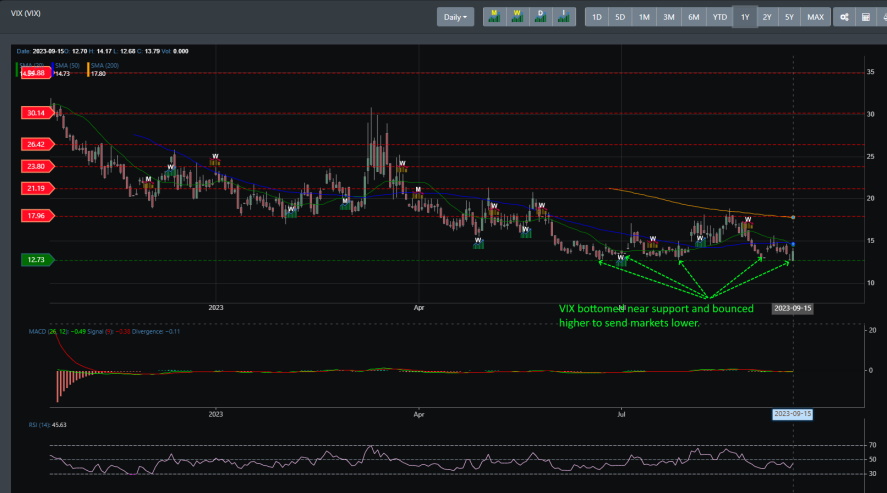
VIX
Looking at VIX on the daily timeframe, we can see that it has bottomed recently to turn around and bounce off support near the 12.73 region. This has an inverse reaction to stock, as evident in Friday's close. There were several occasions this year where VIX bounced off its 12.73 region, which sent markets lower for a short period. This is another potential where the bounce off the low on Friday indicates that markets will move lower in the coming weeks.
Concluding
Resistance is at the 4534 region. Support is at the 4311 region. With Friday's price action, there is a high probability that we will see markets move lower to challenge support. This will play out in the next few weeks, and if prices can hold onto support, we can see the rally continue and challenge its all-time highs before year's end. However, breaking the 4311 region can close the door to that notion. If support does not hold then the next near-term support is right where there was a gap up in 6/1/23. Support at at this point will be around ~4221.