


Encouraging headlines emerged this week, with the year-over-year CPI report falling from 6.0% to 5.0%. While the core CPI year over year did gain .1%, it still leaves markets with an encouraging sign that inflation is slowing down. In addition, the Producer Price Index (PPI) came well below expectations, reinforcing the disinflationary trend. All good news for the bulls as the March CPI report is the lowest inflation report since April 2020.
That said, markets are higher now since the last time we blogged back on March 26 - Down but not out. At that time, markets were treading support, and the banking situation was having the bears call for markets to drop to their October lows. We did not see this happening and stated the following in that article.
"The only question was how deep the pullback would be and would the rally resume. For both SPY and QQQ, that looks to be the case, with weekly bullish signals having fired for this week. IWM is still reeling and could draw down the other indices if it does not start to push back higher. Markets will move higher soon as BullGap's Momentum Market Timer has already triggered a buy signal to the upside."
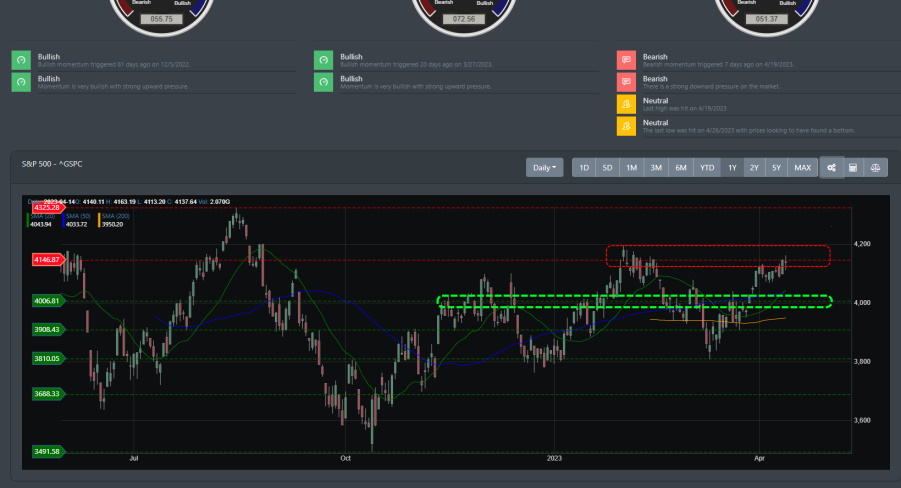
With our weekly buy signal triggering for SPY, QQQ, and DIJA (and our highly successful Momentum Market Timer), we were confident that markets were ready to break through resistance in the following weeks. And indeed, markets have done that. For example, the S&P 500 has pushed to break through resistance at around ~4006.81 and is now challenging the 4146.87 region.
Big Picture
Markets have certainly rallied higher since our last blog, and right now, we can see the S&P 500 attempting to break through resistance around the 4146.87 region. A prior attempt was made back in February 2023 before markets made a deep pullback. Do markets look to have enough momentum to break out this week? Most likely not, and with technical readings already poised for a topping, there looks to be a pullback that may send markets back down to support near the 4006.81 area. The green outline below shows strong support that should hold if the pullback occurs this coming week.
Market Breadth
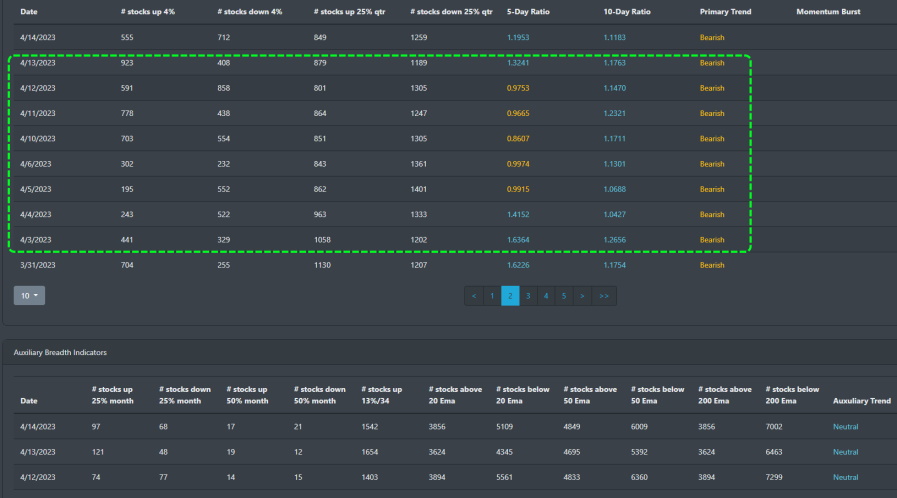
Market breadth has been turned bullish coming into January. However, the intermediate breadth readings are now turning bearish and have done so since heading into early April. The green dotted box below shows market breadth in a cautionary state, with the # of stocks up or down 25% bearish. This is one of the readings that suggest markets are poised for a pullback.
Market Sentiment
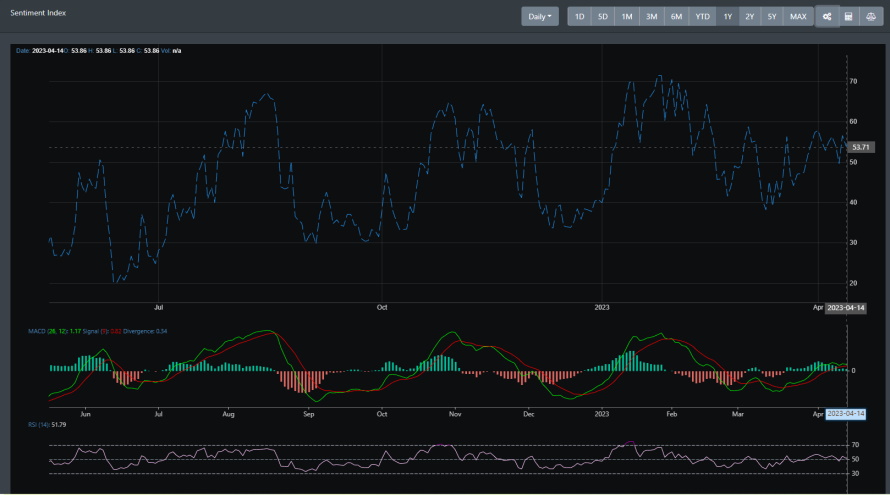
Market sentiment reading has been in neutral gear for most of April. Drawing from our market sentiment data, the MACD is suggesting a topping is taking place. However, the RSI reading indicates that the market sentiment neutral state has a higher probability of staying in the natural state for the near term.
Market Outlook
The bullies are in control as markets continue to rally off the October 22 lows. You would be hard-pressed to find anyone who does not think a recession will occur. And you be even more hard-pressed to see any positive news coming out of the markets. There is an air of pessimism from the doom and gloom crowd still waiting for markets to drop below the October lows of 2022. But it is all in the price action, and markets are currently in rally mode. Let's review SPY, QQQ, and IWM using our zig-zag algorithm to show price action movement.
SPY
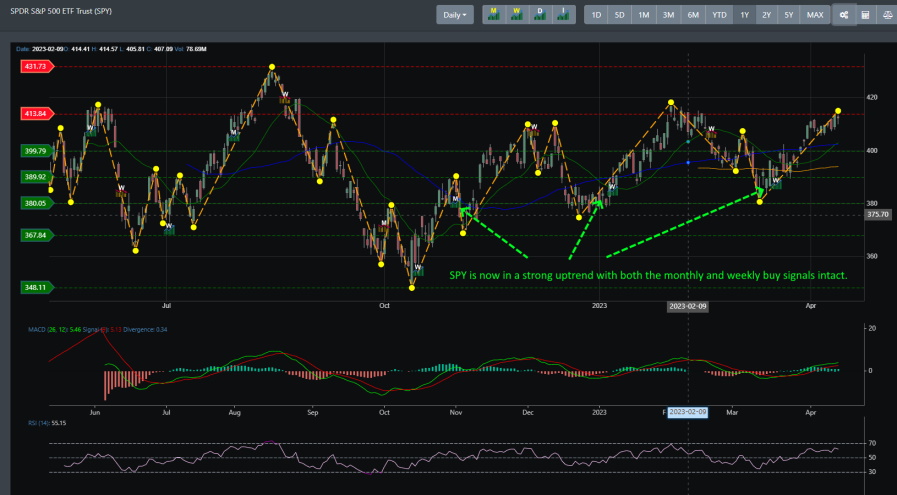
Looking at the daily SPY chart below, we can see that markets have been rallying higher since hitting the October 22 lows. Using our zig-zag pattern algorithm to follow the price action, you can see the expected pattern of a rally. Higher highs followed by sustainable pullbacks. SPY is now in a strong uptrend, with the monthly and weekly buy signals intact.
QQQ
Like SPY, QQQ also hit its low in October of 2022. And similar to SPY, you can see that QQQ is in a strong uptrend. QQQ has been the leading performer since the start of January 2023. It has both its monthly and weekly buy signal intact.

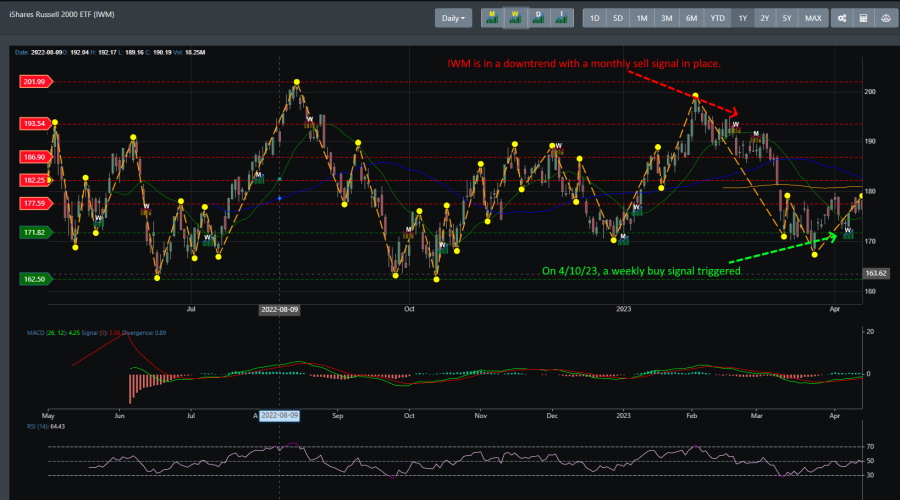
IWM
The zig-zag pattern on IWM suggests a strong downtrend. After rallying strongly to start the near year, IWM topped out in February only to see itself range bound between the 171 and 177 regions. The problem is that a monthly sell signal is causing much downward pressure on IWM. The only good item out of this is that a weekly buy signal was triggered on 4/10/23.
Concluding
March's job report shows a strong labor market, with the unemployment rate at a decade's low of 3.5%. The decline in the PPI report will be a tailwind for Q1 23 earning season as this reading will impact corporate costs. Additionally, the US dollar has weakened since this year's start, which will add fire to corporate profits.
Markets are now technically oversold, and a pullback looks in order. The question is, how deep will this pullback be? There is a high probability that markets could pull back and catch support near the 4069 to 4072 region. If it does not hold at the 4069 region, the next drop will be near the 4006 region, where there is strong support.
If markets do not break through to resistance soon, there is a high probability of a pullback. If this occurs, we see this as a buying opportunity. Buy the dip.