


Since our last blog in early July, markets have been pushing higher to where the S&P 500 closed today at ~4518. When we posted back in July, we noted a few buy-the-dip phases after breaking above the previous resistance at 4311. On 6/20/23 and 7/3/23, we saw FOMO kick into gear with the dip-buying crowd coming out in full force. As we stated in our last blog:
"Now, every strong rally requires healthy pullbacks to alleviate the overbought conditions. The current pullback so far has been corrective but did little to diminish the current overstretch condition in the markets. So, unless there is a strong break of support at the 4311 region and markets continue to buy the dip, the expectation is for markets to continue to rally and challenge the next resistance at the 4534 region."
And just as we stated, markets challenged resistance in late July and broke through above the 4534 region. But the S&P 500 was not the only primary index with a strong rally. We also noted that the Russell 2000 (IWM) could break through to the upside. As we stated in our last blog:
"There is now a high probability that the monthly momentum index will also trigger. If IWM can start participating in the rally, it will aid in triggering the monthly momentum index into the bullish side."
IWM did just that on the same week we blogged about breaking out. It received its monthly bullish signal on 7/3/23 and broke through resistance at 193. Surprisingly, just six months have changed the narratives between the bulls and the bears. Six months ago, the backdrop was still centered around inflation, the highly anticipated recession, and the bear market rally. Today, we are improving the market breadth, strong technical readings, inflation easing, dollar tailwinds, and a healthy homebuilder's market.
Big Picture
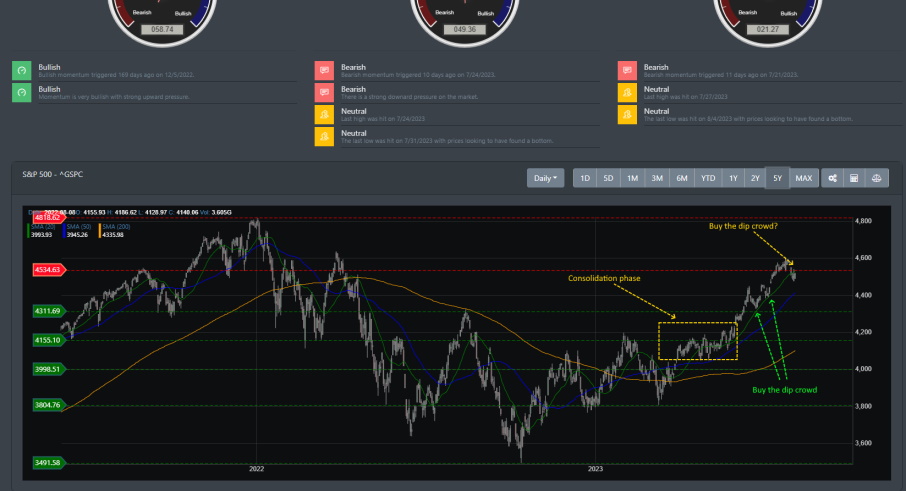
Markets have rallied in July but have recently pullback to start August. From a technical picture, this is no surprise as the technical picture has been highly overextended for most of July. As we earmarked in the image below, there were a few occasions where the dip buyers came out in full force to push markets higher in July. Are we at a point where this pullback forms a consolidation around the 4534 regions?
This pattern plays out when we outlined the "Consolidation phase" that occurred in April\May of this year. After breaking up to the 38.2% region, markets consolidated before moving higher in April. Now, markets have just pushed higher above its 76.4 Fibonacci level and are poised to consolidate or move lower to hit support near the 4311 region.
Market Breadth
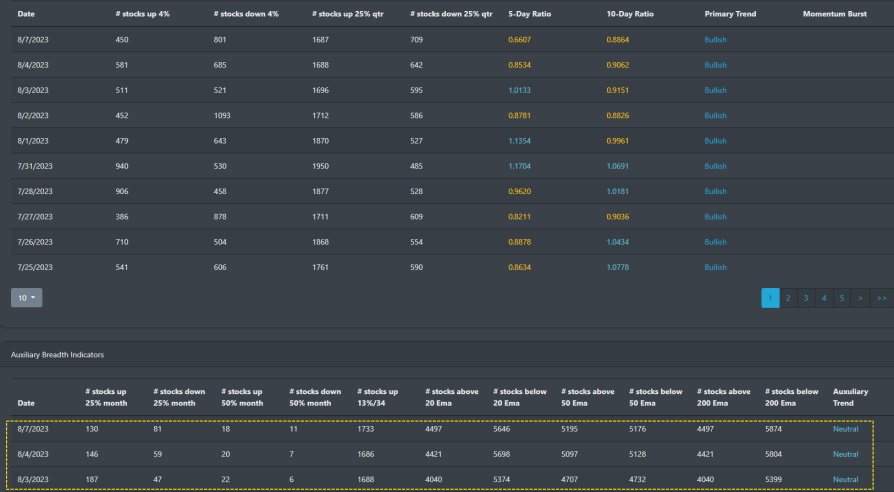
For the past few months, market breadth has been improving. And we discussed some of those details in our prior blogs. Our auxiliary breadth data also showed improvements in the overall stock universe, with stocks above\below their 200 EMA improving to a point that we have not seen since early 2023. However, several of our auxiliary data points still caution about the current market pullback.
Market Sentiment
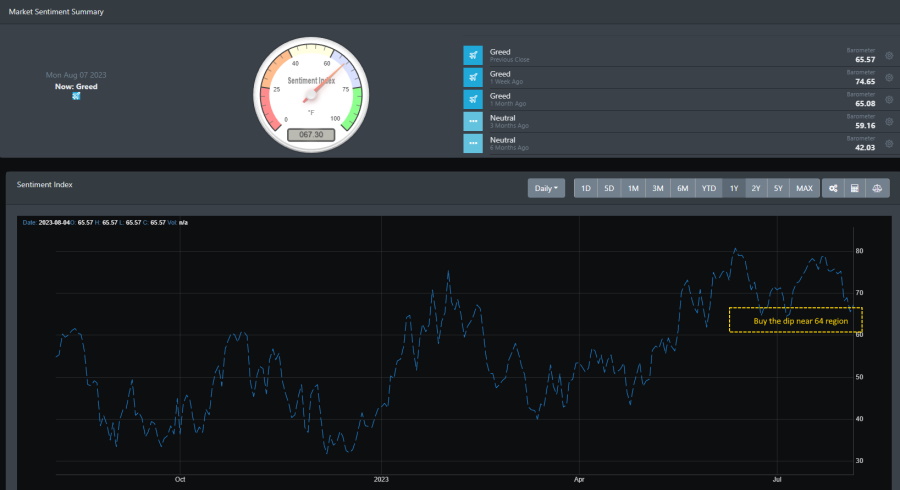
Greed has been the name of the game since July. With our market sentiment indicator reaching levels not seen since 2021. Additionally, the duration of the FOMO level can be seen as the past few drops in the markets were immediately picked up by the buy-the-dip crowd. The current level is near the area where the last FOMO crowd started buying the dip.
Market Outlook
With market breadth improvements slowing down and highly elevated market sentiment, expectations for the rally to continue may be suspended. The bulls are currently on the market, but there are signs in our quantitative algorithms and machine learning datasets that are telling a different story. Let's look at the weekly trend using our TrendFinder strategy to see if it can provide a direction for the current market.
SPY
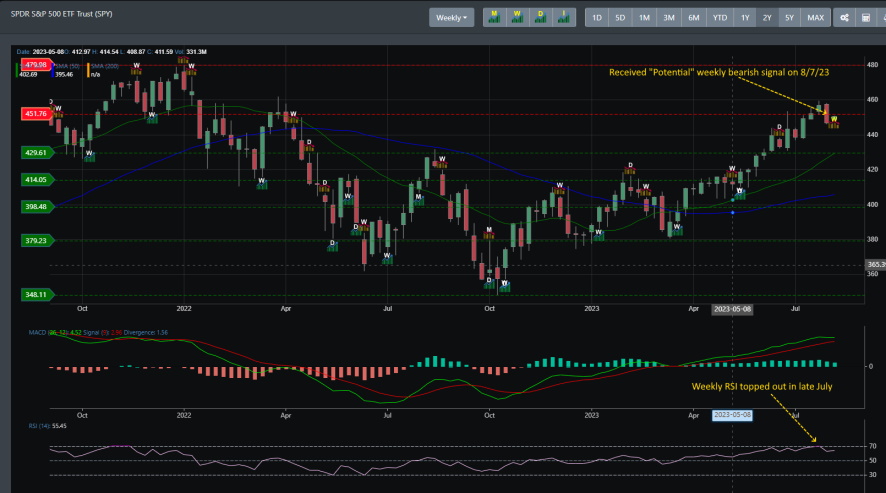
SPY has recently been in a strong uptrend. Since hitting the October lows, it has rallied higher to break through its 78.6 Fibonacci level at 451.76. However, we just received a "potential" weekly bearish signal today. Now, a potential weekly bearish signal only clears out at the end of this week. And it is highly dependent on the price action movement for the week. With technical readings still overbought and a weekly RSI signal topping out in late July, there is a potential that we will see more downside pressure for August.
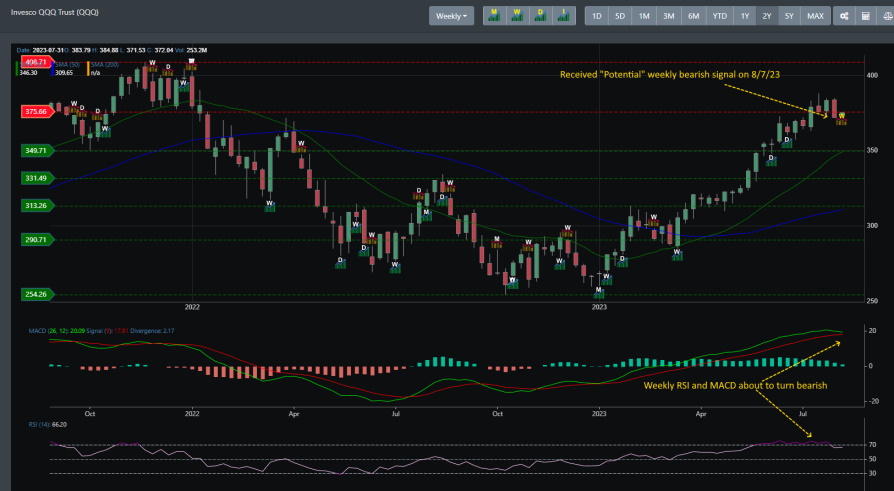
QQQ
Like SPY, QQQ has rallied off its October 2022 lows to break through its 78.6 Fibonacci levels. However, it also did receive a "potential" weekly bearish signal to the downside. Additionally, the weekly technicals, such as the MACD and RSI, look like a topping is beginning.
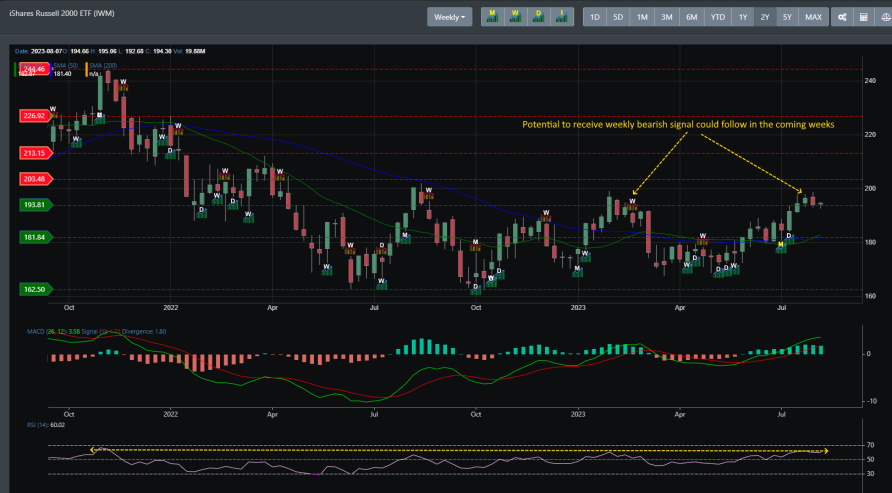
IWM
IWM did break out above resistance at 193.81, but it has a similar topping pattern that can be found from earlier this year. The 193 regions have been contentious resistance point for IWM since July 2022. Looking at the chart below of IWM, you can see that August 2022 resembles this month.
Concluding
Are we looking at a pullback that may impede the move to new highs? The initial setup looks corrective, with August as a consolidation phase. However, if the pullback is impulsive and downside pressures start mounting, the next support level for markets is at the 4311 region. For now, one should be patient and allow the market to unfold. If the pullback follows a corrective fashion, the next buy-the-dip opportunity could be here in the coming weeks. The only issue we have is weekly bearish signals triggering on all major indices. And with the overbought conditions in the current rally, there is a high probability that markets will move lower, and we see a test of support near the 4311 region.