


Markets had a pullback from last week's record high to close out on Friday's session at 5204. While the S&P 500 is experiencing a minor decline from its previous high set back on 3/8/24 near the 5264 region, all major indexes are still near all-time highs. With the latest signs that oil prices are poised to rise in the coming months, inflation concerns are still on the minds of many investors. The Fed has also tried to temper expectations that any rate cuts will come at any time soon. Bear in mind that they all but committed to rate cuts in 2024. If you have read our prior blogs, you will know we are trying to correlate recent news events with market direction and just stating what is currently on investors' minds.
However, in our last blog, we spoke the following comments: "Market conditions are highly overbought, and the VIX is now firing a monthly buy signal. This signal typically indicates that a pullback is due. Support is currently near the 5040 region, and if markets can hold this region, there is potential for FOMO to push markets higher in the near term (with resistance near the 5300 region). However, there is a strong indication that bullish sentiment is exhausted, and a welcome pullback is forming."
Our last blog was posted in early March, and markets almost reached the 5300 region. However, they have since topped out at 5264. Can markets still run higher? Let's take a look at what our data tells us.
Big Picture
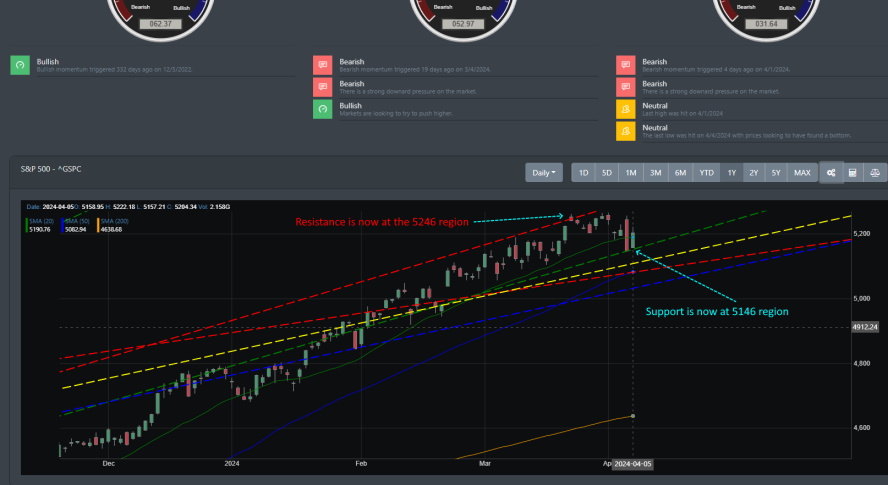
For financial markets, Q124 has kicked started well. The S&P 500 is up +30% from last year's October 23 lows. Most high-flying stocks have seen gains of +50% within this time frame. Now, markets have hit a wall, and the bullish momentum is declining. We can see in the image below that the S&P 500 is currently sitting on resistance near the 5146 region. The 5246 area is presently resistance. Primary technical readings such as MACD, RSI, and the various stochastics have been overbought for months. As we know, in a strong bull rally, these technical conditions can last longer.
Market Breadth
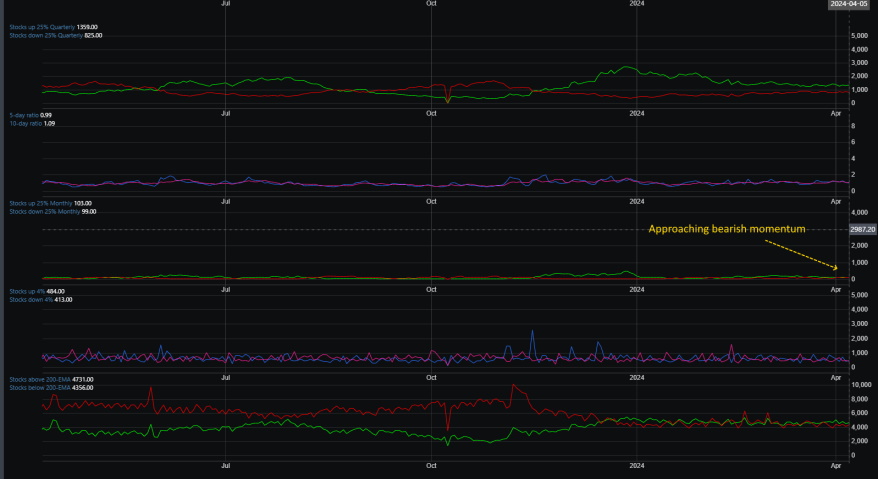
Market breadth has been improving since the start of 2024, and conditions are currently "stable." The intermediary breadth readings are consistently positive, but there is no real uptrend. The momentum has been declining to normal levels without much of a hiccup.
Market Sentiment
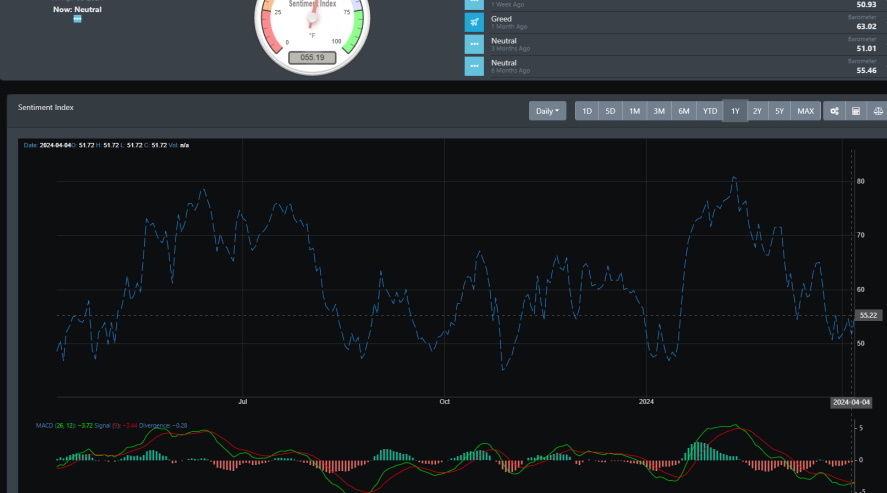
Though markets have been heading higher, we can see on our sentiment chart that everything is not so cut and dry. Investor sentiment has been in greed mode for much of the year, but we can see that sentiment has declined in early February of this year. You can see a downward stair-step on 2/12/24, 3/4/24, and 3/21/24. All of them coincide with markets having declined the following trading sessions. Investor sentiment is now reading naturally, but there is potential for sentiment to reverse course in the near term, with sentiment being at crucial support.
Market Outlook
Are markets gearing up for a move higher, or are there indications that markets are poised to pull back? Markets have shown weakness, but this is far from being a pullback. At the larger time-frames, the uptrend that kickstarted from the October lows 2023 is still intact. However, we are seeing some bearish weekly readings that may strongly impact markets in the coming weeks.
SPY
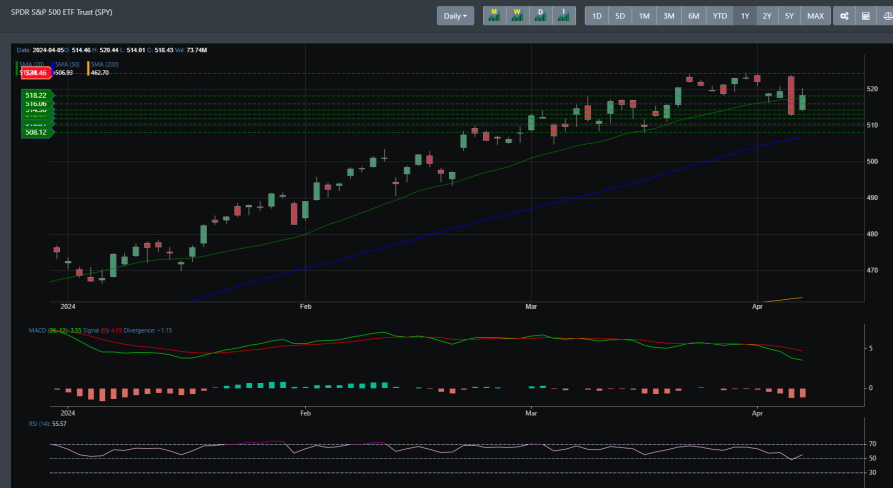
SPY has been on a solid rally since its monthly and weekly buy signals were triggered in late October. Though it has hit resistance recently, it is still in a major uptrend with no weekly bearish signal triggering. Even with the recent small drop, the technical readings are still highly overbought, and if conditions continue to show weakness, there is a high chance that we see a weekly bearish signal on the horizon.
QQQ
Like SPY, QQQ has been in a strong rally since the October 2023 lows. However, it recently received its first bearish weekly signal since 1/2/24. Though weekly bearish signals for QQQ can be short-lived, this is a much-needed signal to see if more price action downside can alleviate some of the overbought technical readings. There should not be a concern yet with this signal unless a monthly bearish signal triggers at some point.
p> 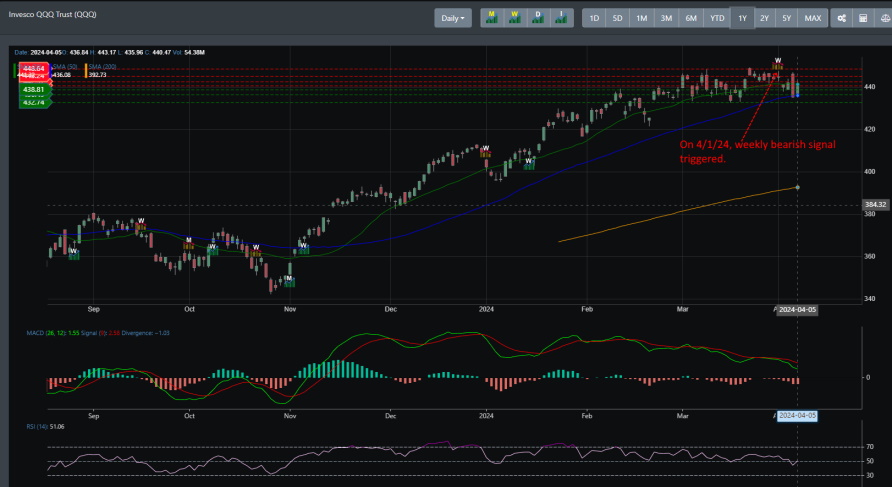
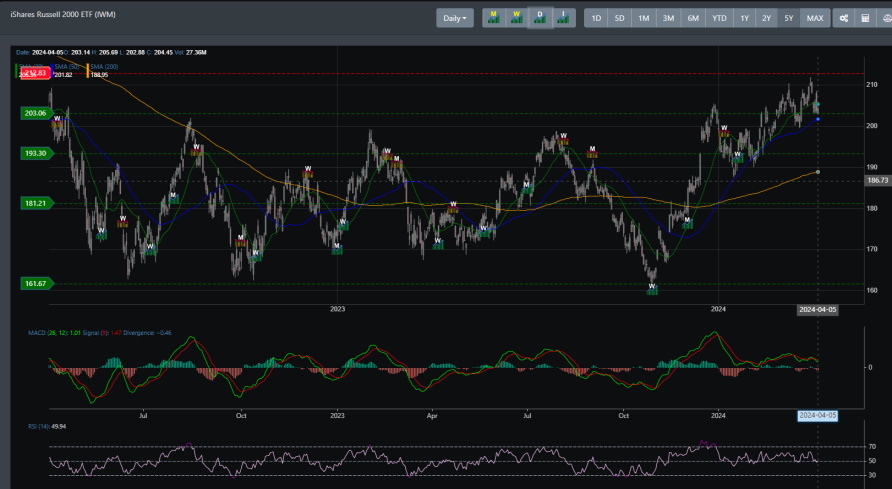
IWM
IWM looked like it was breaking out after receiving its weekly bullish signal on 1/22/24. However, it is trying to hold onto support at the 203 region. It closed out Friday's trading session right over 204. As we stated in our last blog about IWM, any breakdown of the 203 support region could mean that it remains within its range-bound price action of the last two years.
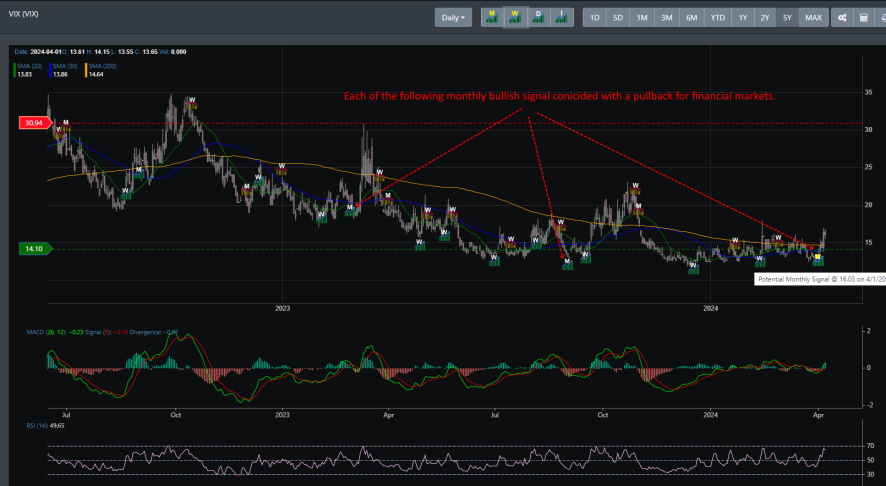
VIX
VIX is precarious, as it received a monthly bullish signal on 4/1/24. Looking back historically at when this signal triggers, we can see that markets typically have a pullback the following trading sessions. We see this on other monthly bullish signals for the last few years.
Concluding
Are markets consolidating, or are they gearing up for a pullback? Right now, our data is showing markets poised for a pullback. Market breadth has stayed neutral, and we have yet to see a strong push in the bullish trend. Additionally, as noted above, weekly bearish signals trigger major indices that typically indicate a reversal. Though not all indices are triggering this sign, it is clear that there is a high probability that we see more downside in the coming weeks. It is still possible that this is a consolidation period, but markets will have to hold support and try to break through to resistance at the 5300 regions before we can clearly see that a near topping is approaching.
We will have to wait and see how the market plays out in the coming weeks.