


Thanksgiving week has past and with the shortened week, all major U.S. indices found themselves in the red. Even the crypto market was not immune to the holiday drop this week. The S&P 500 wrapped the week down -2.3% off its previous all-time high. The Russell 2000 was the hardest hit index with a drop of more than -4.9%. Nasdaq did not fare too well dropping almost 4%. There was definitely a knee-jerk reaction to the Omicron news that came out on Friday that gave reason for investors to start selling. However, if you look at the data that we will present in this blog, you will see that markets were starting to turn over already. In fact, they started a week before Thanksgiving. Let's take a look at the data and see if it could have provided more insight than just mere headline news about impending market doom.
Big Picture
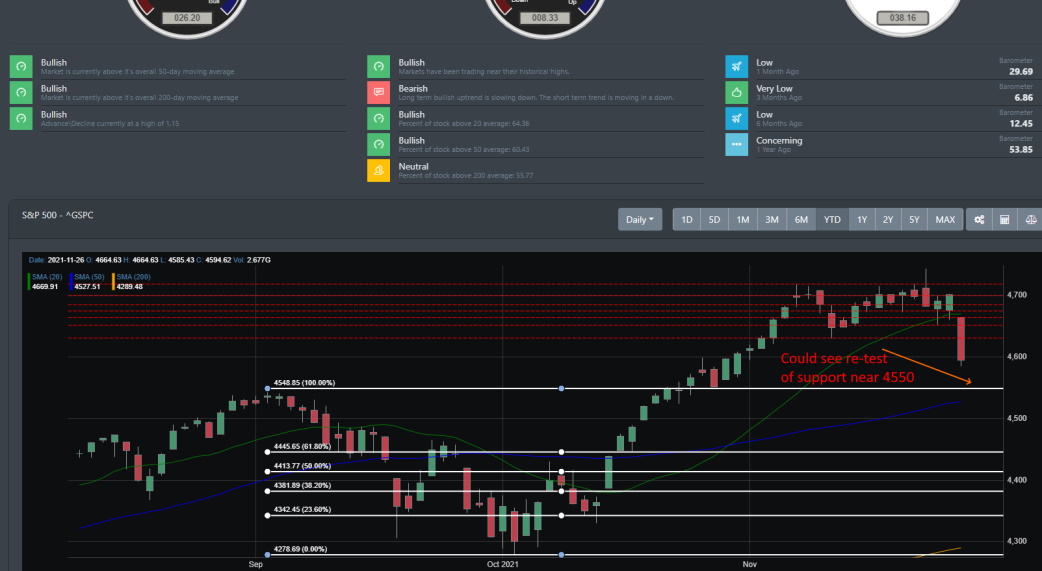
Markets began this week with a jostling between the resistance line form by a previous high. This gave way to a Monday intraday high that then saw markets consolidate right into Turkey day. On Friday, things change as news came out regarding a new COVID variant. The news caused a knee-jerk reaction that sparked a selloff of all major indices. So, is news of Omicron the main culprit for the current market dip? If we look at the chart below, we can see that the S&P 500 did hit a high on 11/22 Monday. However, what is not so obvious, is that the index failed to hold support once breaking through resistance. It then started moving lower throughout the week.
Market Breadth
With FOMO in high gear for most of November, markets started surging up. However, if we start looking at the underlying market data, market internals was clearly showing a bearish divergence. The table below outlines some key market internal data points that provide insight to the strength of the underlying market. Starting on 11/16, markets breadth started to slow down. On Monday 11/19, market breadth switched from reading bullish to bearish. What this historically indicates is the lack of breadth among the universe of stocks that are driving the market upward.
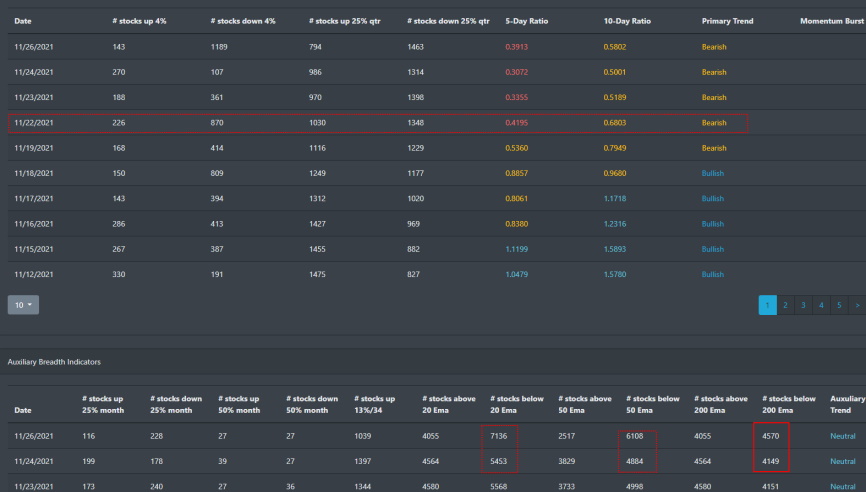
Looking at some of our auxiliary data shows that the number of stocks below 20, 50, and 200 EMA started to inch higher. On Friday, it made a significant move higher as there was nearly a +25% increase in the number of stocks trading below their 50 EMA.
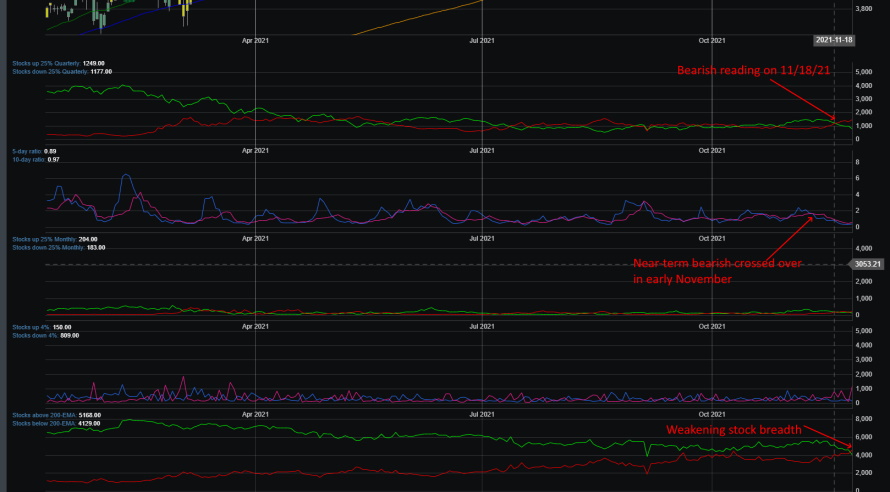
If we look at the chart below, we can see the bearish cross-over that signifies a downturn in the market. All of these signals and market readings were well before the market drop that occurred when news came out on Friday regarding the Omicron scare.
Market Sentiment
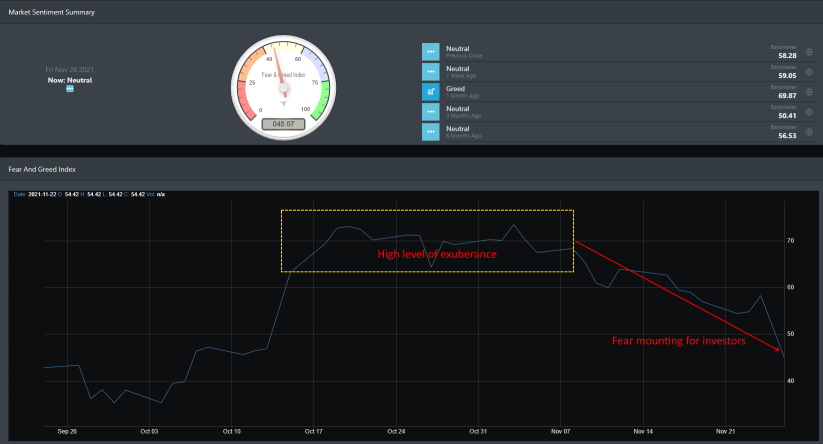
BullGap's market sentiment index even was signaling a bearish divergence that was occurring well before the 11/26 Omicron news. If we look at the chart below, we can see that the October rally was in line with a historically high level of market sentiment reading. And as we discussed in our prior blogs, this prolong high level of reading typically ends with markets ready to do a near-term dip. This so happen our market sentiment started declining into mid-November.
Market Outlook
Let's look at the ETF indexes through the lens of our tool called TrendFinder. TrendFinder allows us to look at any individual stock or index and determine the overall trend. These trends are broken into different timeframes which we identify as Monthly, Weekly, Daily, and Intraday readings. A bullish trend is identified in the chart by the green buy icon with the associated letter denoting the timeframe. And a bearish trend is identified in the chart by a red sell icon.
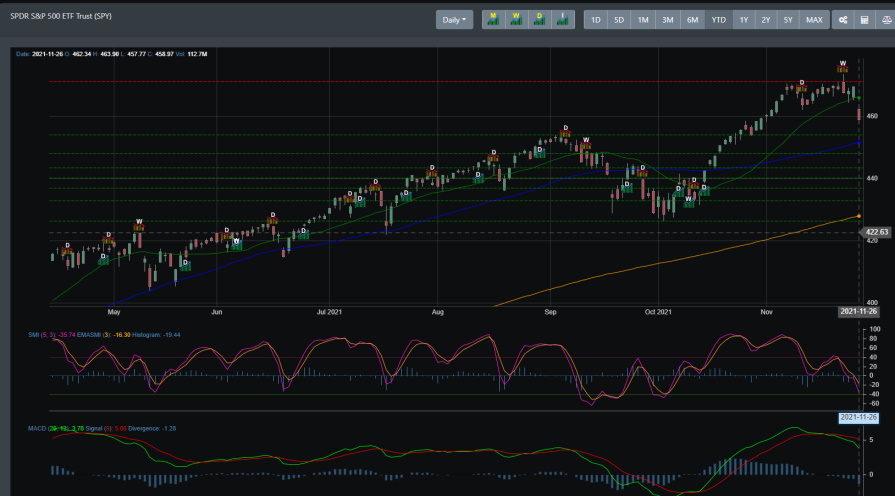
SPY
On 10/11 SPY signal was a weekly bullish signal that saw the index rally to over 8% right into November. Then on 11/10, it received its first warning with a daily sell signal. This was then accompanied by the bearish weekly sell that was signaled on 11/22 Monday. Weekly bearish reading is a signal that typically signals a dip in the symbol.
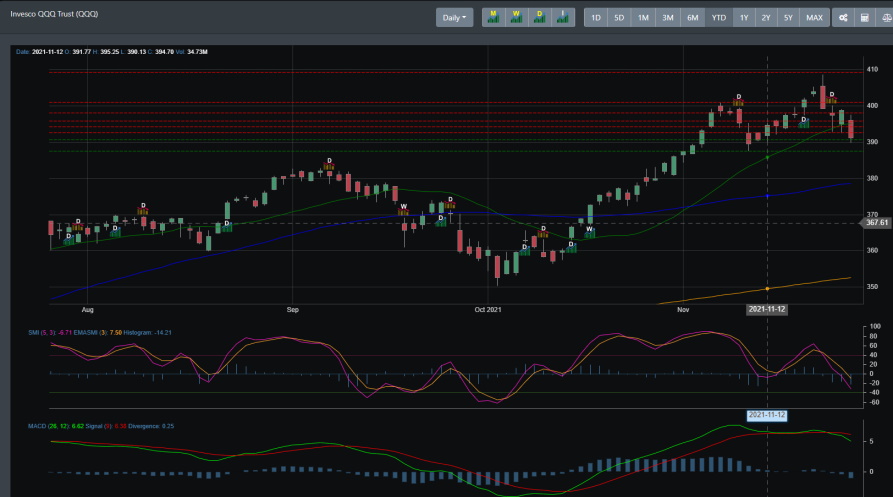
QQQ
QQQ has a much stronger outlook since rallying on the bullish weekly signal set back on 10/18. Unlike SPY, QQQ did not break through resistance this week and is now trending lower. It has already broken down through its near-term support and expectations are that a weekly bearish signal will be triggered next week.
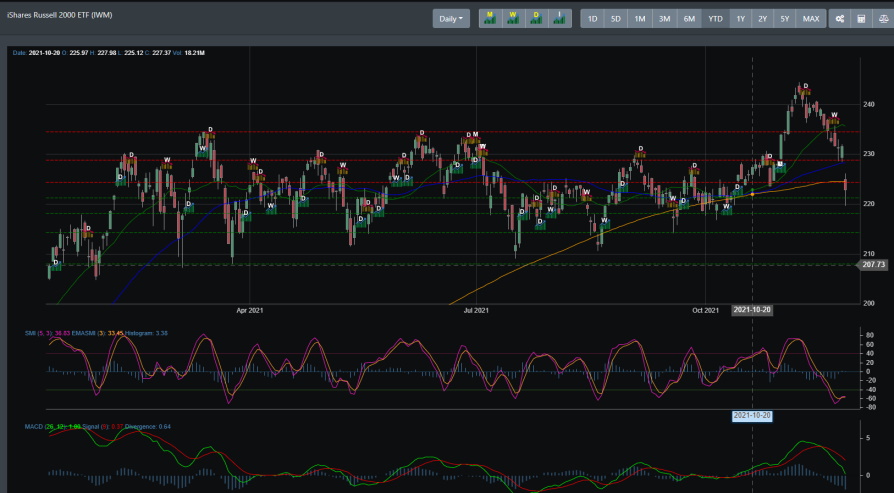
IWM
IWM was in a spectacular rally since hitting its weekly bullish signal on 10/11. Right before breaking out of its year-long consolidation pattern, IWM received a monthly bullish signal on 11/1. It then proceeded to break out of its top resistance before receiving the bearish signal 11/10. It has now dropped well into its lower-level support and most likely will meet support around the 215 to 220 range.
Concluding
So, sensational fearmongering news does make headlines. And certainly, they can cause a knee-jerk reaction to the financial markets. But as we discussed before in our blogs, we are currently in a strong bull market and the expectation is for a Santa Rally to move markets higher by year's end. Omicron did not cause the market to drop as many market news outlets will let you have. By looking at the data above, it is clear that market breadth was losing steam and BullGap's trend provided signals of markets turning over before Omicron came around.
So right now, that set up for next week looks like a move lower to the downside. There is a high probability that we see the S&P 500 have a re-test support near the 4550 support region.