


In 2022, persistent inflation has been the key driver for the drawdown in the U.S. financial markets. While the 2020 short-lived bear market resulted from the COVID-19 outbreak, the current market drawdown has been primarily driven by the Fed's strategy in fighting inflation. In their attempt to subside inflation, the Federal Reserve has moved to restrict liquidity in the market and reduce its balance sheet. With the CPI report coming out this week where it maintains that inflation is subsiding, market participants had a jolt of FOMO before Powell's dovish comments sent markets back under the S&P 500 200-day moving average (DMA).
After slowing rallying from the October lows to challenge the 200-DMA, the S&P 500 is now ~19% down for the year. And with the close on Friday, the S&P 500 ended ~2.1% lower with the worry of a recession looming and central banks keeping rates higher. So the hopes of a Santa Claus rally are quickly fading for December 2020.
Big Picture
Market conditions have certainly had a look of topping out. As we noted in our last blog, the following statement:
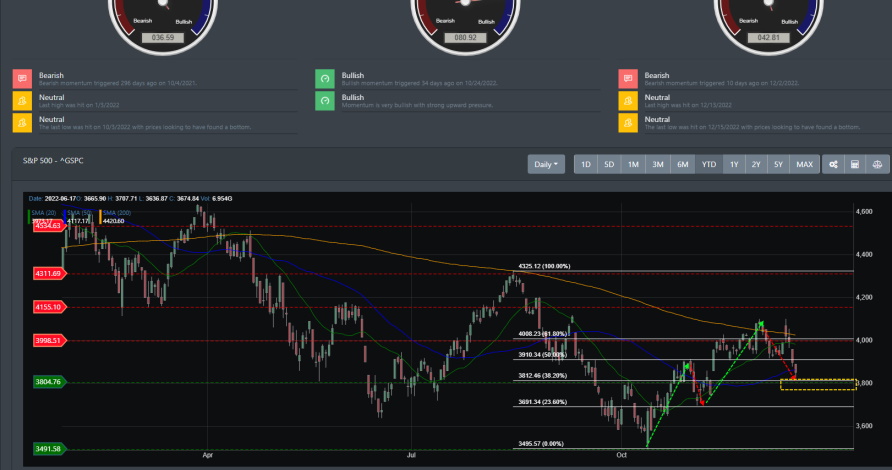
With the bullish technical setup, the current rally looks to have more momentum to push higher. However, next is a test for which the bulls failed to move higher back on August 16. That comes around the 3998 to 4010 region, and this scenario sets up the bull for a retest of the 200 DMA. But before we get there, with the recent daily readings at near-oversold, there should be an expected pullback in the very near term.
That comment was made on 12/4, and the markets did have the retest and potential breakout of the 200 DMA on 12/13/22. However, it was short-lived as the SP500 had a breakdown of prices right into its next support region near the 3800 region. At the moment, the 4000 resistance region is the key resistance area. But before it can make another attempt to retest resistance, prices must hold at the 3700 to 3800 region.
Market Breadth
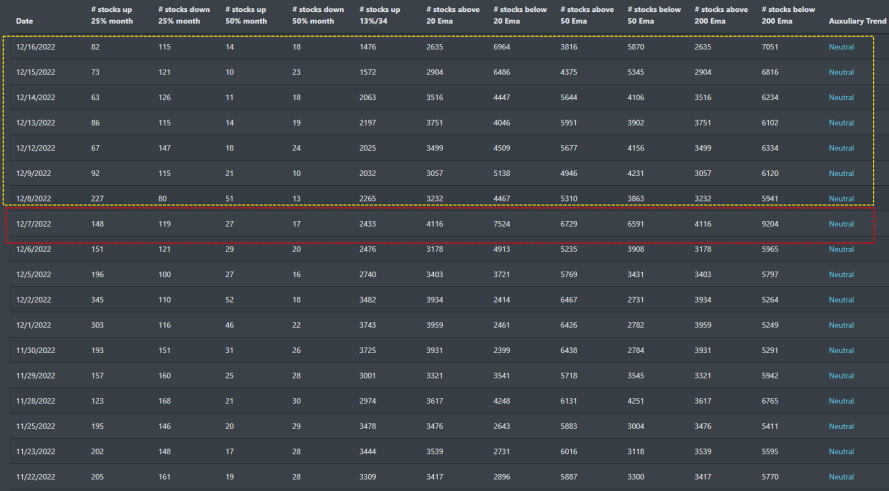
Recent market breadth has been on solid footing since the bullish cross-over in Stocks up/down 25% quarterly. With current December data, the auxiliary market breadth data is turning bearish. Looking at some of the supplementary market breadth data below, we can see where a bearish divergence started to creep in. On 12/7/22, stocks above\below their 20, 50, and 200 EMA posted a stark reading suggesting that the current rally has topped out. Before that market, internal data were bullish and have since been bearish. At least for now, the current internal health reading of the market suggests that there is little upside to be had in the recent rally.
Market Sentiment
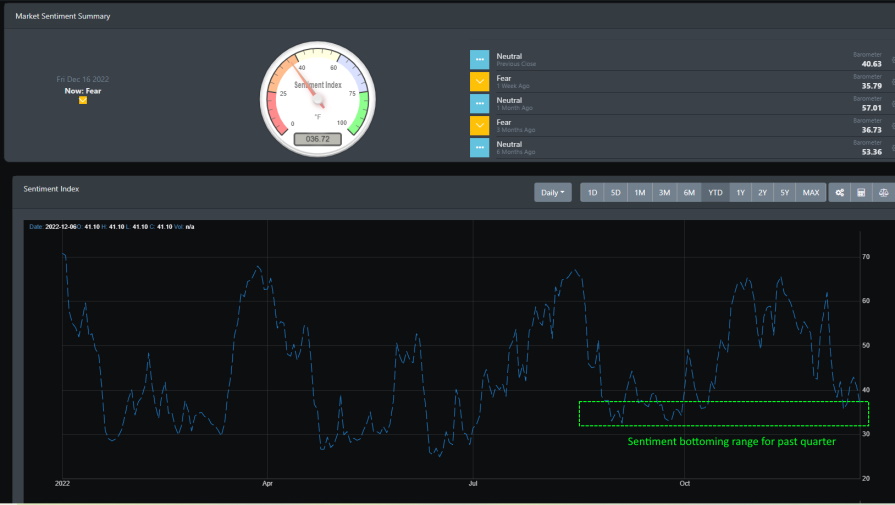
Not springily, with a current reading of 36.72, market sentiment has moved back to fear mode. And the fear and neutral readings have been the swan song for most of the past six months. There is only a little optimism to be found across the board. Right now, sentiment is settling around the 34 range. That range has been the bottom region for the past quarter.
Market Outlook
In our last blog, markets favored the bulls, with crucial signals lining up for another strong rally higher. With more recent technical data, the major indices have a look at topping out. Let's take a look at the technical charts from the daily timeframe.
SPY
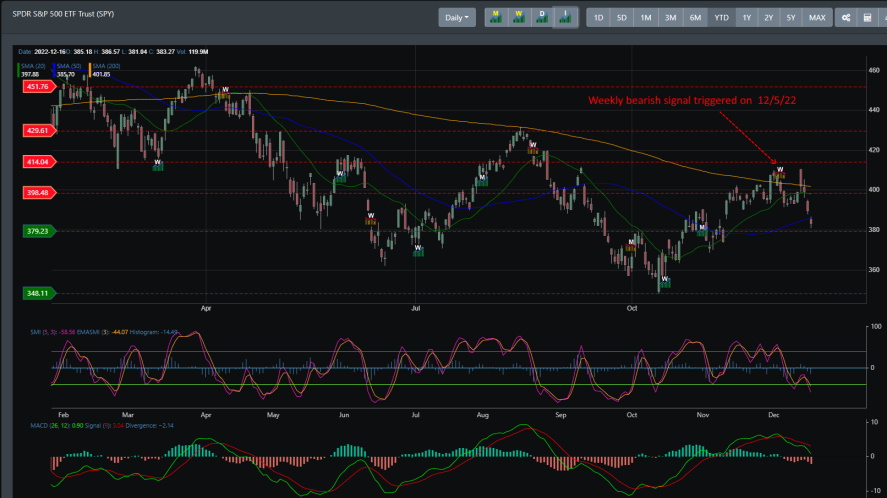
SPY has been rallying since hitting its weekly bullish signal on 10/17/22. It also had a monthly bullish signal on 11/1/22. With bullish monthly and weekly timeframes, SPY rallied higher to challenge its 200 DMA. While SPY temporarily closed out on its 200 DMA in early December, it received its weekly bearish signal on 12/5/22. Prices have since dropped and are now near support at the 379 region.
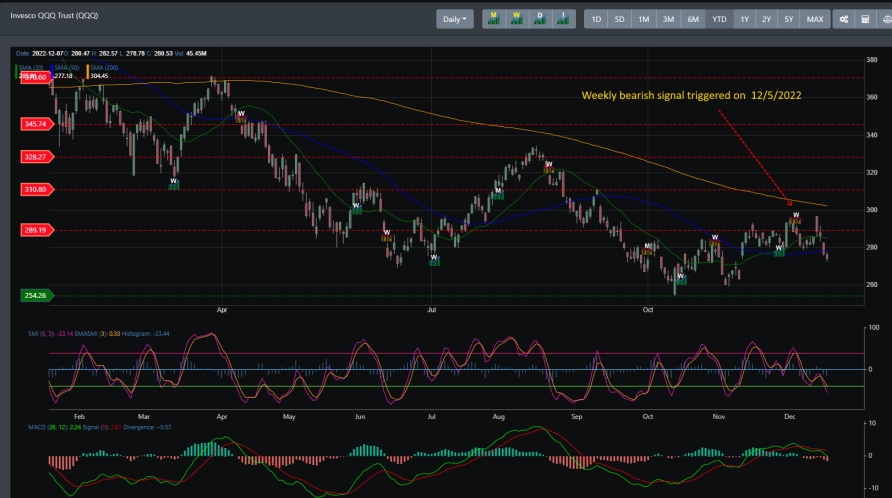
QQQ
Like SPY, QQQ also received a weekly bullish signal on 10/17/22. But unlike SPY, QQQ never received a monthly bullish call which can be seen as why it has not rallied from its October low. Instead, there have been subsequent weekly bullish and bearish signals with the most recent being the weekly bearish signal set on 12/5. Resistance is at the 290 region, and there is still downward pressure where QQQ may land near the 254 region.
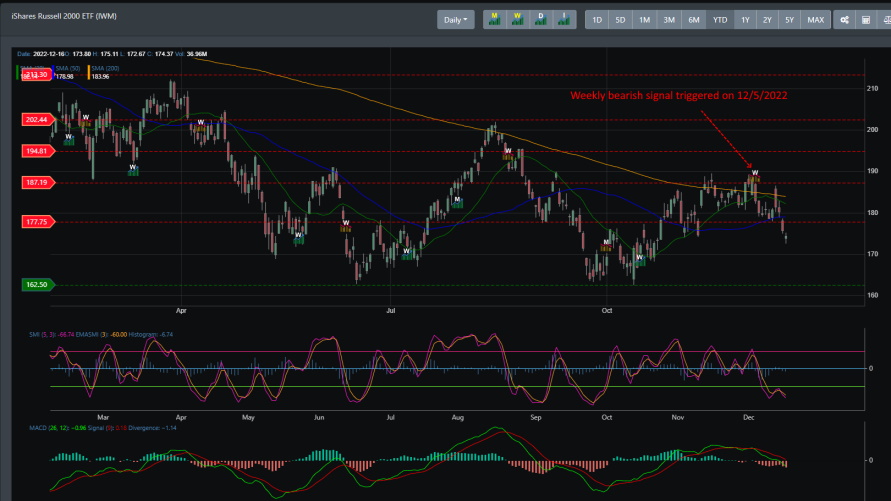
IWM
Like SPY and QQQ, IWM had a weekly bullish signal on 10/17 and rallied to resistance near the 187 region. It made two attempts in November and December to break through but ultimately was unsuccessful. Finally, on 12/5/2022, when the weekly bearish signal was triggered, selling pressure dropped IWM right through support near 177, prices look to be headed near the 162 region.
Concluding
The historically strong December month for U.S. equities is looking to be more of a scrooge awakening than a Santa rally. That said, markets are right on support near the 3700 to 3800 region. The bulls can swing back up if the current pullback can hold this region. Any breakdown of that support can mean more selling pressure for the markets. Though the technical setup shows bearishness, gauging how our sentiment data has behaved for the past quarter suggests that this current pullback should stabilize around the support area mentioned above.