


Moving Average Convergence Divergence
Moving Average Convergence Divergence (MACD) is one of the most popular trading indicators. This indicator, created by Gerald Appel in 1979, was designed to show the direction of the trend, measure the strength of the trend, momentum, and identify whether a trend will reverse direction.
Many traders use MACD because it is considered very simple and effective to show the direction of trends and market momentum. But before learning more about MACD, it is very important for us to understand the concept of moving averages. A moving average is simply a line that represents the average value of previous data in a predetermined period.
Moving averages can be divided into two different types, namely Simple Moving Average (SMA) and Exponential Moving Average (EMA). SMA provides the same weighting for all input data. While EMA gives more weight to the latest data values.
Main Components of MACD
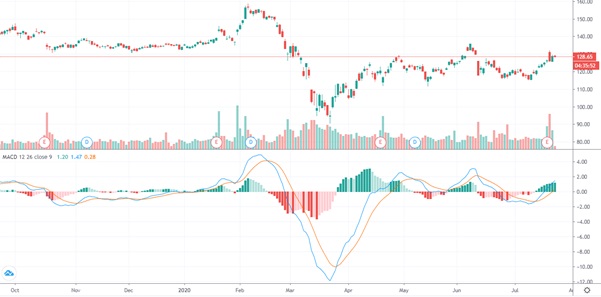
To find out more about MACD, there are several main components of MACD that you should know about. The standard MACD on the Metatrader platform has the following components.
MACD Line
MACD Line is calculated by subtracting the 26-period Exponential Moving Average (EMA) from the 12-period EMA, (EMA 12 - EMA 26). The period can be changed according to preference (minutes, hours, days, weeks, months). However, this article will focus on a daily timeframe.
MACD Line can help traders determine upcoming bullish and bearish market trends. If EMA 12 is greater than EMA 26, the MACD value is positive, and the MACD area is above zero. This indicates that the uptrend is strong. Conversely, when the EMA 12 line is below the EMA 26 line, the MACD value becomes negative, and the MACD area is below the zero lines. This indicates a downtrend.
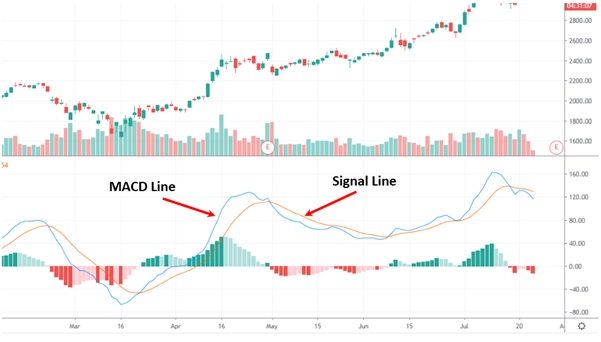
Signal Line
In addition to the MACD line and area, to find out the right to buy or sell momentum, Signal Line is also used. Signal Line is a nine-day EMA of the MACD value. It is plotted on top of the MACD Line.
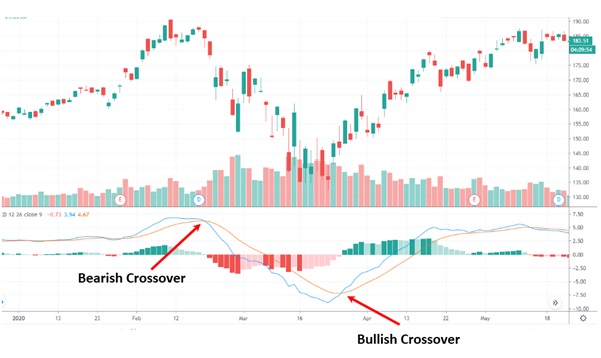
Signal Line can be used to indicate a change in the momentum of a trend. Traders may buy the security when the MACD crosses above its Signal Line. Under these conditions, the market is in oversold momentum. Conversely, when the MACD crosses below its Signal Line, this becomes a signal for traders to sell the security. Under these conditions, the market is in overbought momentum.
In addition to being applied to MACD, Signal Line can also be applied to other technical indicators, including Stochastic Oscillators. The Signal Line is not an indicator, but it is commonly known as a "trigger line". So, it will be calculated differently for each indicator it is used in.
Histogram
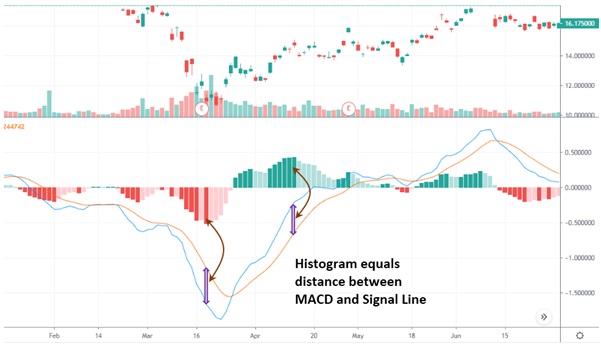
MACD-Histogram or also called Oscillator’s Moving Average (OSMA), was developed by Thomas Aspray in 1986. This MACD-Histogram is the difference between the MACD value and the Signal Line (Histogram = MACD Line - Signal Line). Like MACD, the MACD-Histogram is also an oscillator that fluctuates above and below the Zero Line. The Histogram is positive when MACD is above its Signal Line, and negative when MACD is below its Signal Line. Histogram bar height depends on the difference between the MACD value and the Signal Line.
The direction of movement of the MACD-Histogram can be used as a trading signal, especially when the histogram bar moves away from the Zero Line, or when the bar appears longer or shorter. However, a more valid signal occurs when the histogram bar reaches a peak or valley. Traders can place sell positions when the histogram bar moves from the top to the Zero Line, and place a buy position when the histogram bar moves from the valley to the Zero Line. The signal obtained can be faster than the conventional way where traders usually wait for the crossover between MACD and Signal Line.
The size of the long histogram shows a strong price movement. When a new trend is formed, the MACD-Histogram is generally short-sized and then increasingly elongated. The peak of the trend occurs when the market moves at full strength, and this is marked by the longest histogram bar. Then when the momentum starts to weaken, the size of the histogram bar will get shorter, and the MACD area starts sloping and looks smaller.
Zero Line
Zero Line is also known as the centerline. The MACD Line oscillates above and below the Zero Line. A bullish centerline crossover occurs when the MACD Line moves above the Zero Line to turn positive. This happens when EMA 12 moves above EMA 26. This can be used to confirm an uptrend.
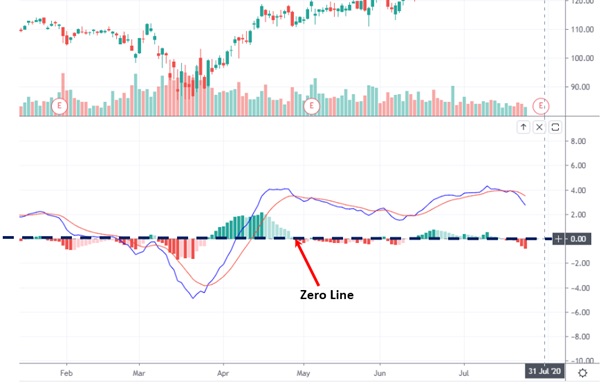
Otherwise, a bearish centerline crossover occurs when the MACD Line moves below the Zero Line to turn negative. This happens when EMA 12 moves below EMA 26. This can be used to confirm a downtrend.
Divergence
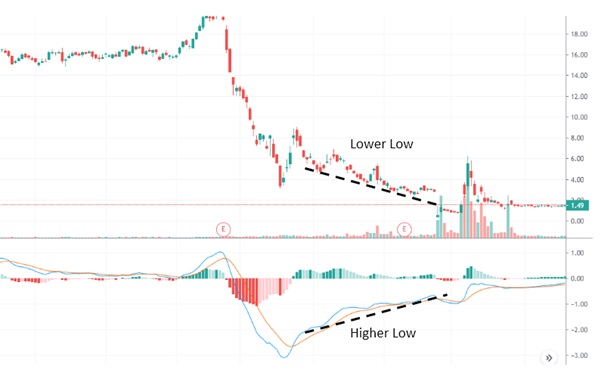
In trading activities, convergence is a condition in which prices and MACD move as if they will unite. In this condition, the price moves down while the MACD Line moves up. This is a sign of the end of the downtrend.
Meanwhile Divergence is a situation where prices and MACD move as if they are distant from one another. When price makes a new swing high, the MACD Line actually moves down. The Divergence can show a reversal signal. When prices tend to rise (forming a higher high) but the MACD area actually decreases (creating a lower high formation), it indicates that the uptrend will end soon. The signal of the end of the uptrend is due to price increases not supported by strengthening momentum.
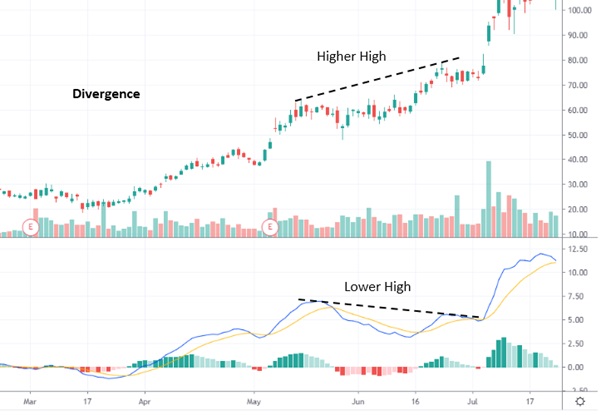
A “positive divergence” or “bullish divergence” occurs when the price makes a new low but the MACD does not confirm with a new low of its own. A “negative divergence” or “bearish divergence” occurs when the price makes a new high but the MACD does not confirm with a new high of its own.