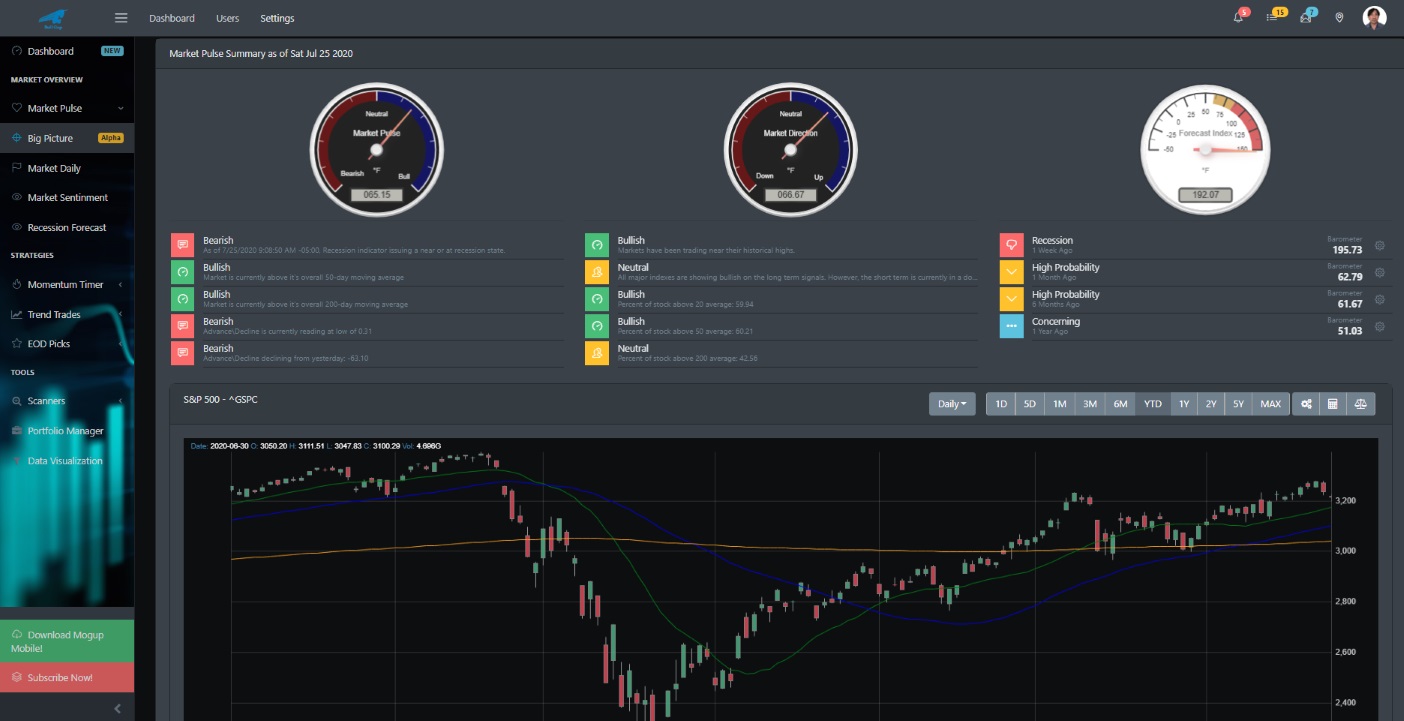
The Market Pulse provides a barometer of the current state of the market. Bear, Bull, market correction.
Market Pulse
For an investor to be successful, you need to be able to break down the current market conditions. Understanding where the market is and deciphering its movements will allow you to be a more profitable trader. Is the market currently on an up-trend? Down-trend? Is it currently correcting?
If all you do is listen to the market news and\or follow analyst predictions, you will most likely get misled by all the different opinions between the bulls and the bears. You want facts. Not opinions.
Market Pulse provides 4 key items daily for you to help you gauge the market. This is done through technical analysis.
Big Picture
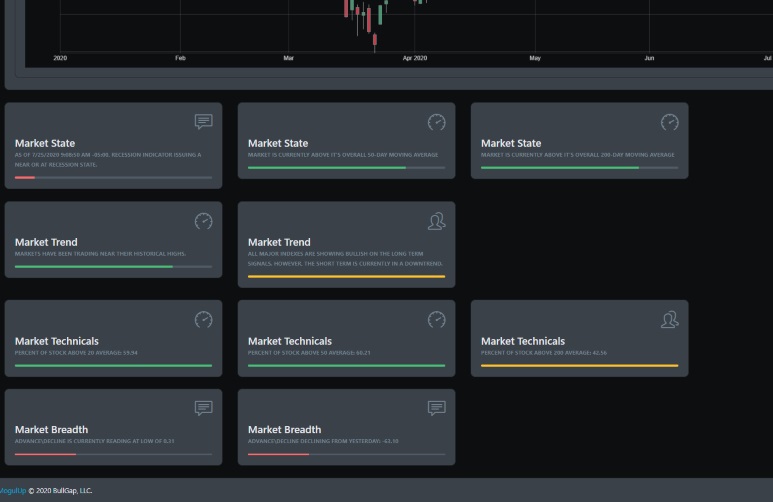
The big picture gives you a snapshot of the overall trend of the current market. It identifies whether the market is currently in a Bull or Bear market. Additionally, it lets you know whether they're currently in an uptrend, downtrend, or correction in the market place.
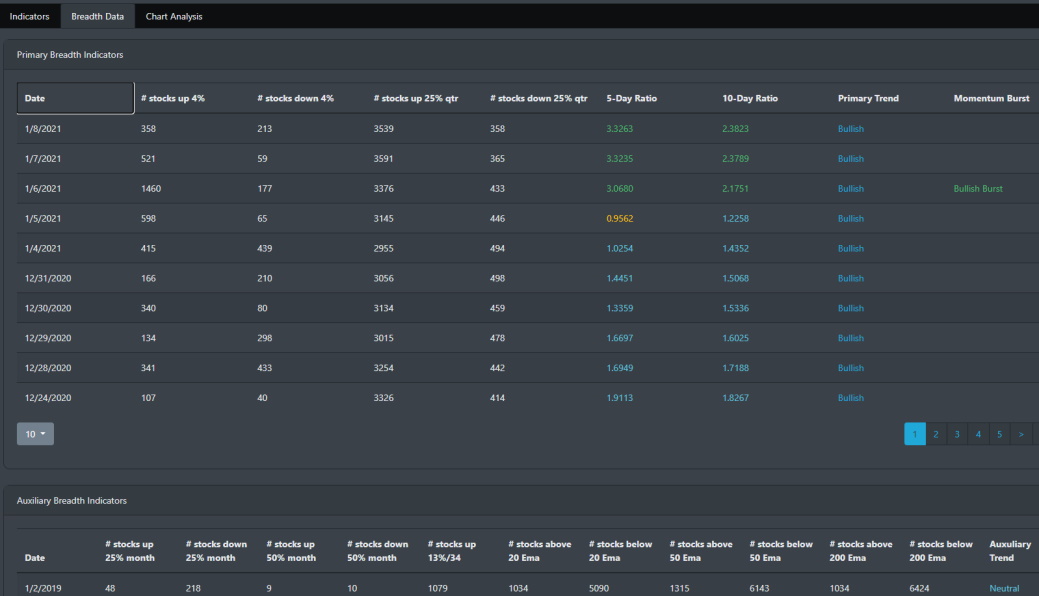
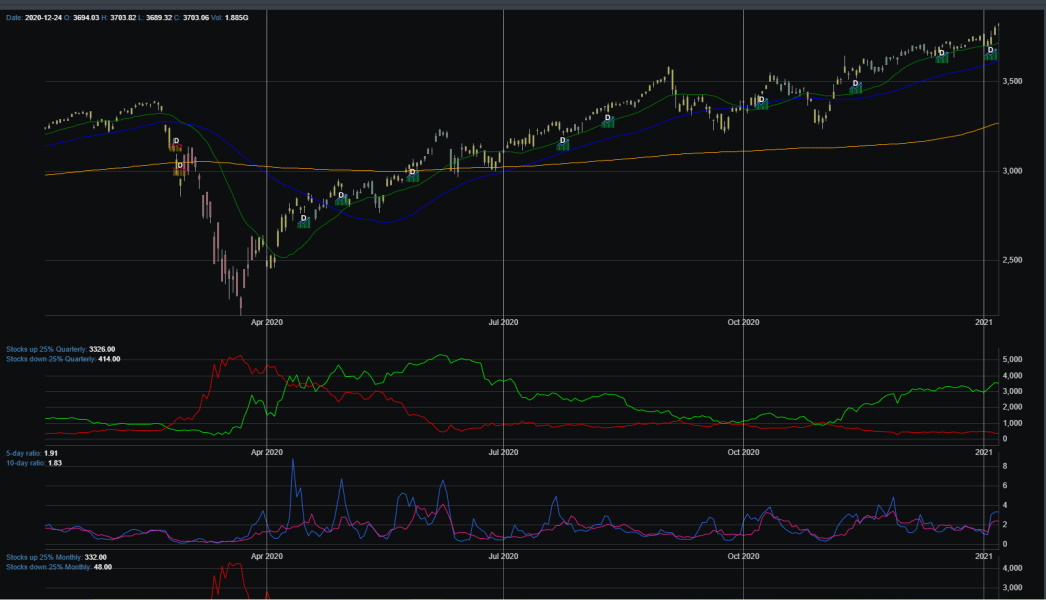
Market Breadth
Market breadth analysis is at its simplest form the study of advancing and declining stocks at any one time. Market breadth is positive when the total number of stocks in a pool is more than the number of stocks that are negative. BullGap's market breadth tool filters this stock pool from a universe of stocks that trade at a specific volume and price criteria. Doing this allows our tool to identify major market moves with less noise. Additionally, the Market Breadth tool identifies and signals Momentum Burst (uptrend or downtrend) that signals entry and exit points for trading.
Below are some screenshots of the Market Breadth Dashboard.
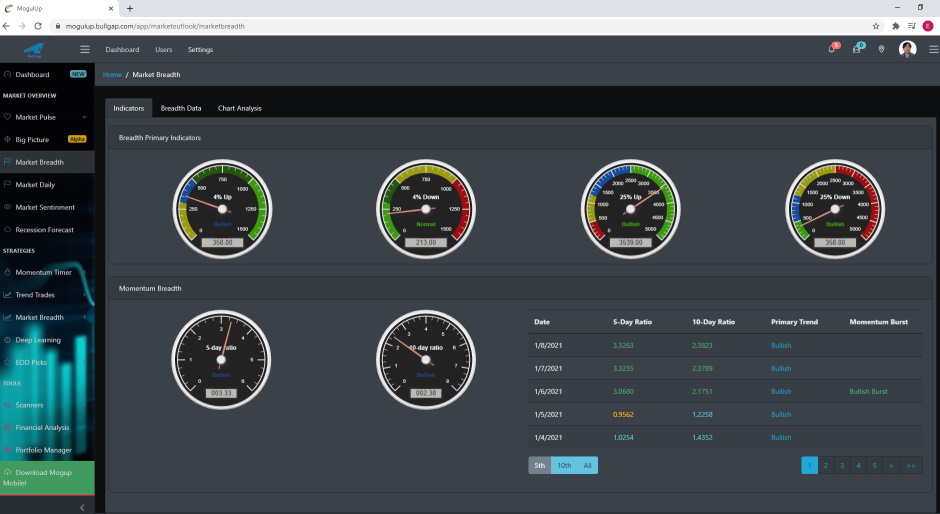
Get a full daily detailed breakdown of stocks that are moving up\down 4%, 25% primary trend, and much much more!
Market Breadth Chart analysis view
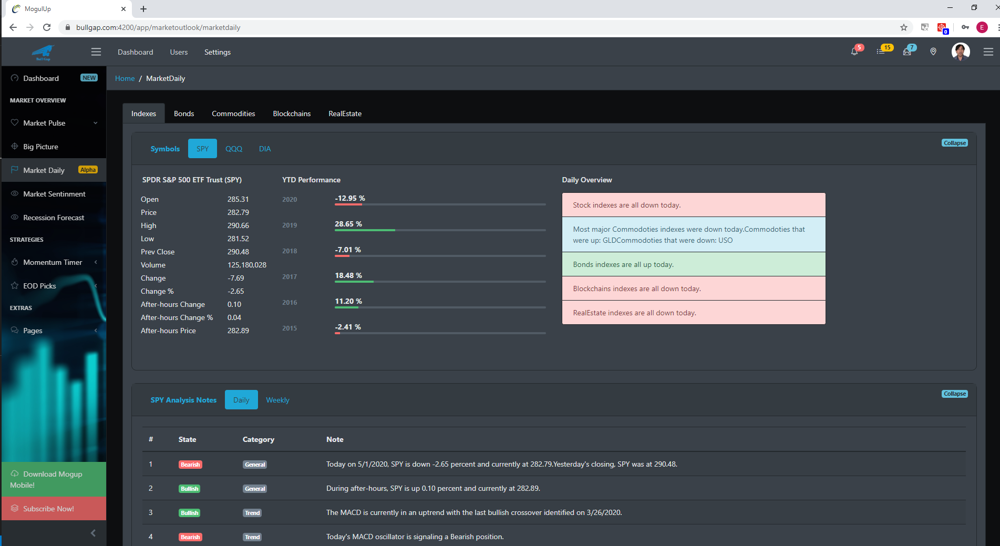
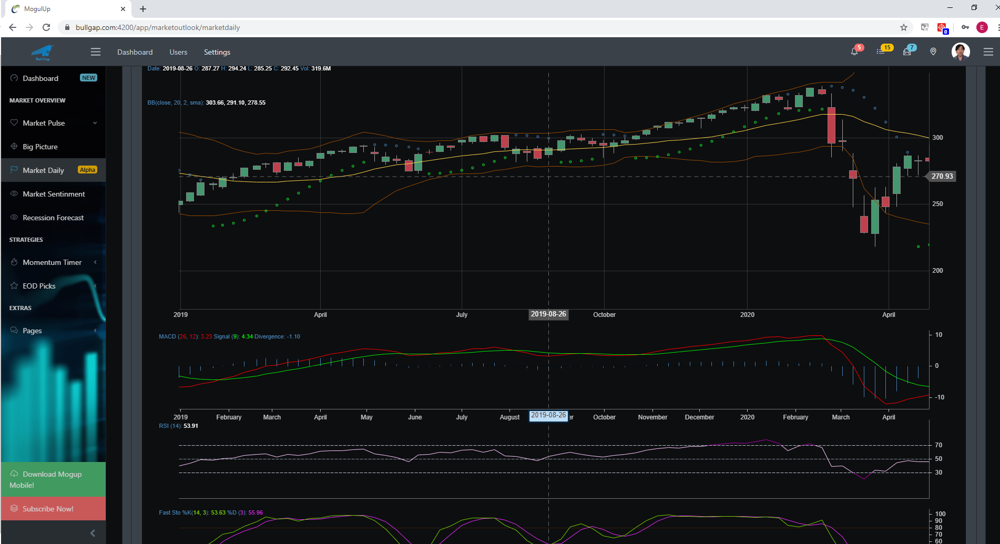
Market Daily
Gives you insight every day on what is occurring in the market place. Market daily gives you a daily snapshot of the market from all major stock indexes, commodities such as gold and oil, bonds, real estate, and even bitcoin. Additionally, you are given trending notes and technical charts for each market. Daily, Weekly, and Intraday (coming soon) charts are provided for your review.
Below are some screenshots of Market Daily.
Market Sentiment
Here at BullGap, we have built a Fear And Greed Index to help you estimate investor sentiment in the stock market. Using modern sentiment indicators, live market data, and important core technical analysis, we built an index that is near real-time and provides you with the lens to see when investors are feeling greedy or at the fear stage. When investors are in a greedy state, it normally indicates they are buying or will buy stocks. This pushes prices up by increasing demand. And vice-versa, if investors are feeling fear, it tends to indicate they are selling or will attempt to sell stocks. This in turn will drive stock prices down.
Fear = Sell = More Supply of Stocks for Sale = Stock Price Decreases
Greed = Buy = More Demand for Stocks = Stock Price Increases
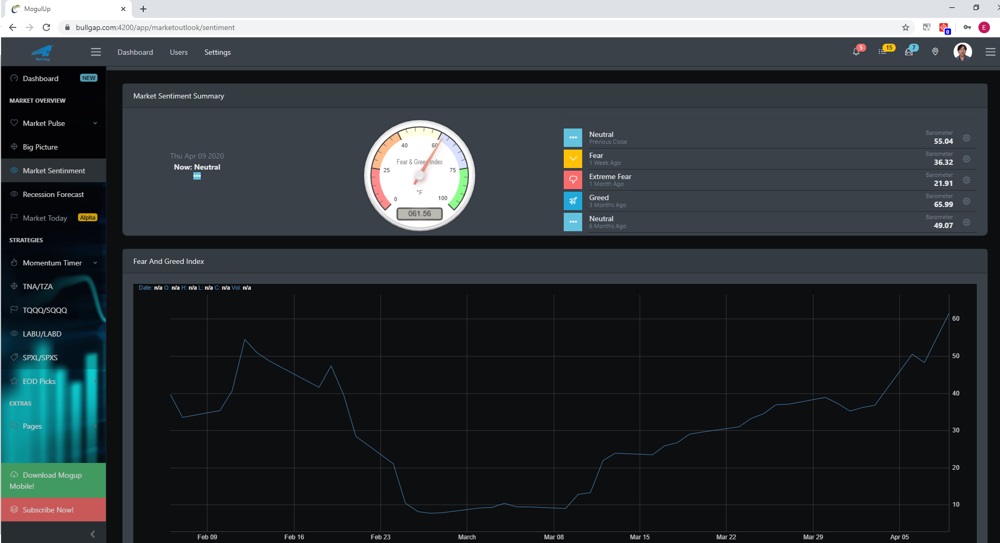
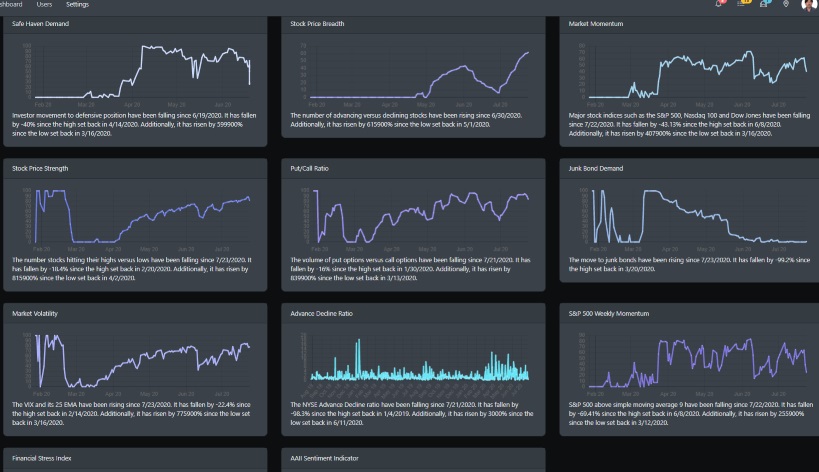
Market Sentiment Indicators
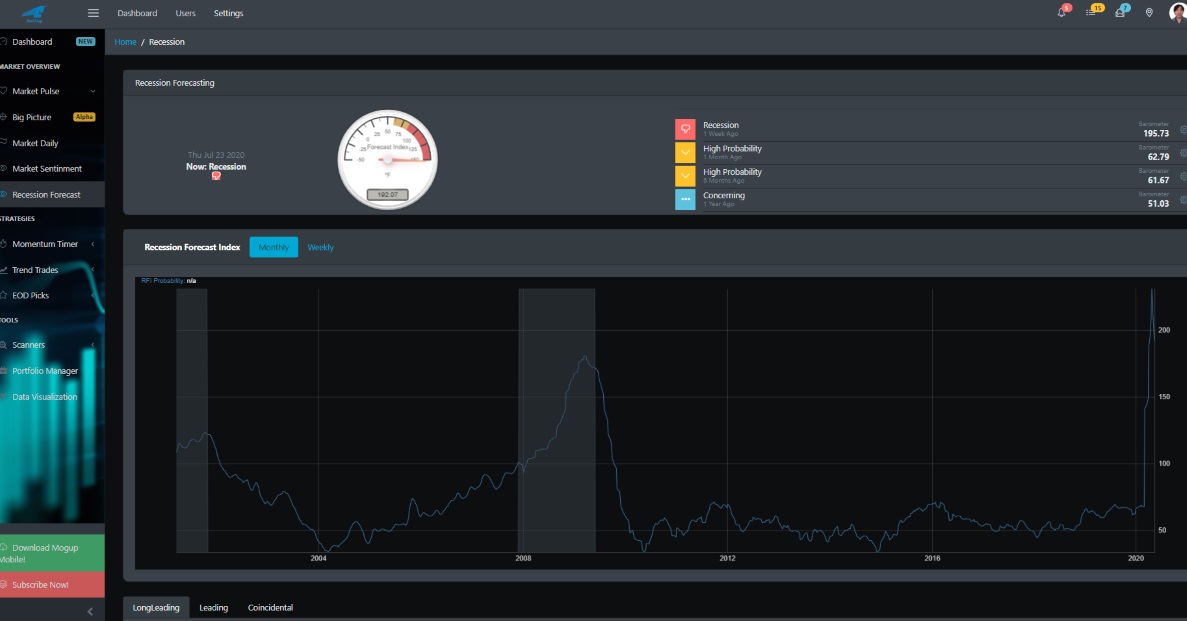
Recession Forecast
Help protect your investment portfolio by using BullGap's proprietary Index on the state of the United States economy. Obviously, nobody can 100% predict the arrival of the next recession. Pulling from several data resources such as the bond market, unemployment rate, claims record, GDP growth, treasury yield, corporate profits, commodities, manufacturing, and other data points, we are able to identify a recession when our indicator gauge reaches above 80.
Through back-testing and available data, the recession index has been able to identify the past 7 recessions. Lead times on average were about 1 month.
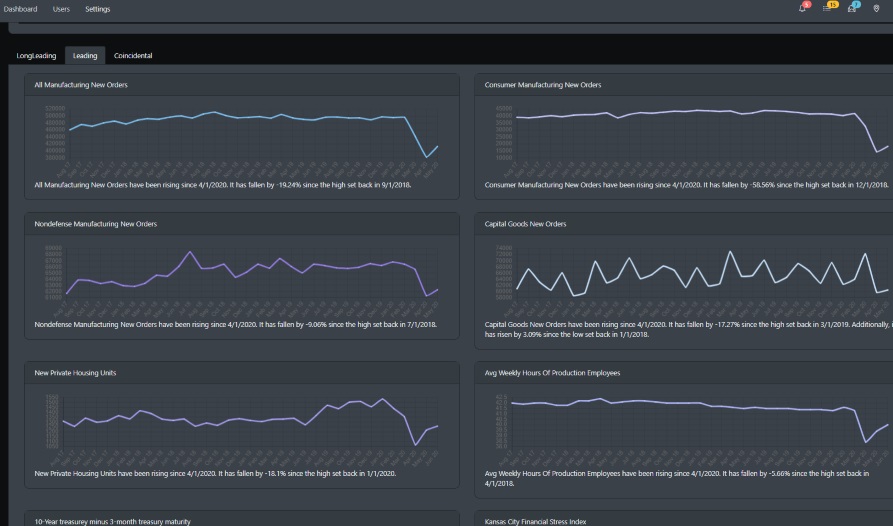
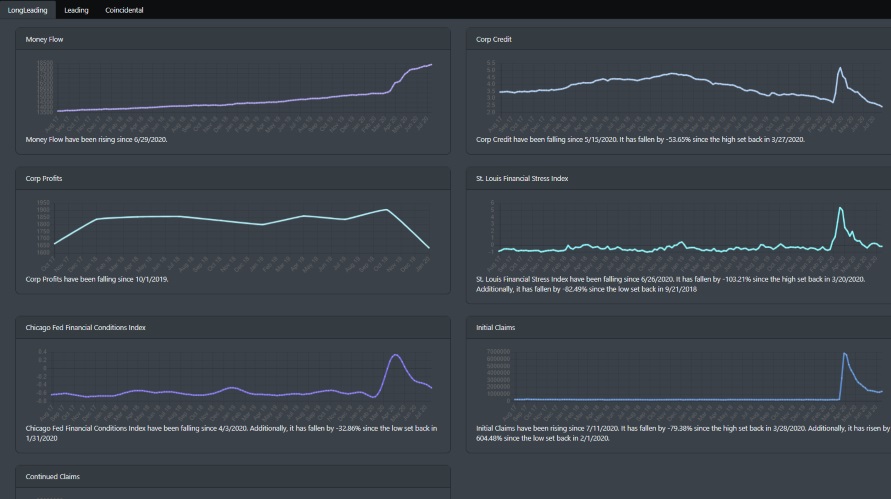
Recession Long Leading Indicators
Recession Leading Indicators