


The financial markets have pulled back more than 10% since the start of August, and at the current moment, there is a possibility that markets can head lower in the coming weeks. Some may see the recent pullback as a product of the rise in the 10-year treasury yield. Others may contribute to the Fed's current message that rates may stay higher for some time (no foreseeable rate cuts in the near term). Additionally, a strong Q3 GDP reading this week shows the price deflator up +3.5% has put a setback on the inflation front.
Markets are now in a very precarious state as there are several bearish readings on the charts that suggest more downside is possible. In our last blog in early October, the S&P 500 closed out under the 4300 region of support. And we stated in the following statement:
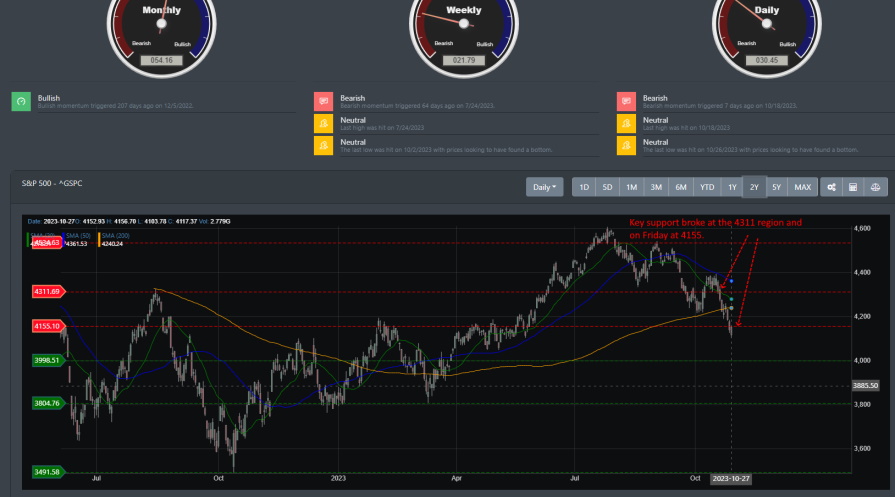
Currently, markets are just trying to hold onto support at the 4311 area. If, in the coming weeks, markets can maintain support at the 4311 region and rally above it, there is a high potential for markets to challenge resistance at 4534. If 4534 is broken to the upside, we may see a likelihood of markets challenging the previous highs set back in January 2022.
Markets did rally the following week and broke momentarily above the 4311 region. However, that was short-lived, and markets have fallen through critical support.
Big Picture
Critical support for the major indices has broken this month. As shown in the image below, when markets could not hold the 4311 region, it broke down and dropped to the 4155 support region. The monthly and weekly bullish trends have been broken, with prices clearly under the 200 DMA. On Friday, markets did investors no favor, with prices closing under critical support at 4155. Support now is at the 3999 to 4000 area.
Market Breadth
Besides the mega-caps carrying the markets, most market participants have been flat for the better part of the year. Though the S&P 500 and Nasdaq still show a positive return for the year, the Russell 2000 is in corrective territory, with the average stock under -7%. For a bull market to take hold, small caps have to deliver, and right now, the technical picture shows a bearish divergence in mega-caps and small-caps.
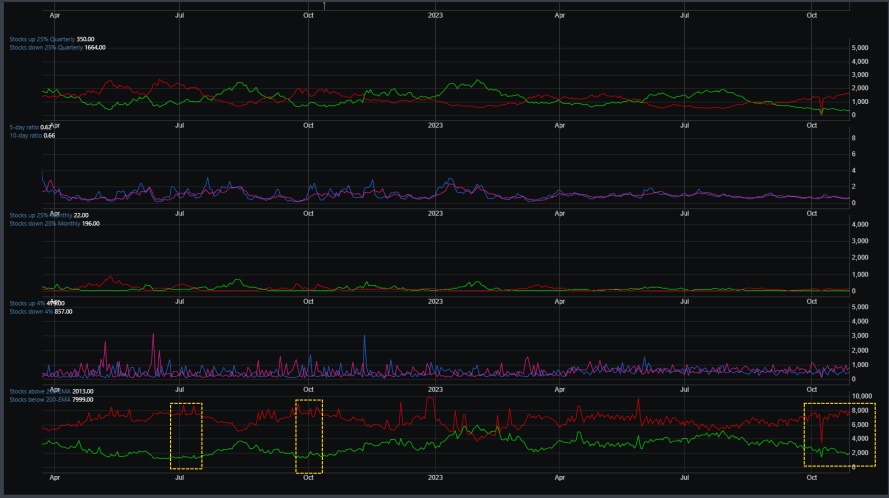
One glimmer of hope that can be seen in the chart below of some key market breadth indicators is the graph below of stocks above or below their 200 EMA. In the three yellow outlines, these are instances where market breadth reached "critical" mass. In July of 2022 and October of 2022, when more than 80% of stocks were below their 200 EMA, the market reversed and started rallying. We are currently in this state.
Market Sentiment
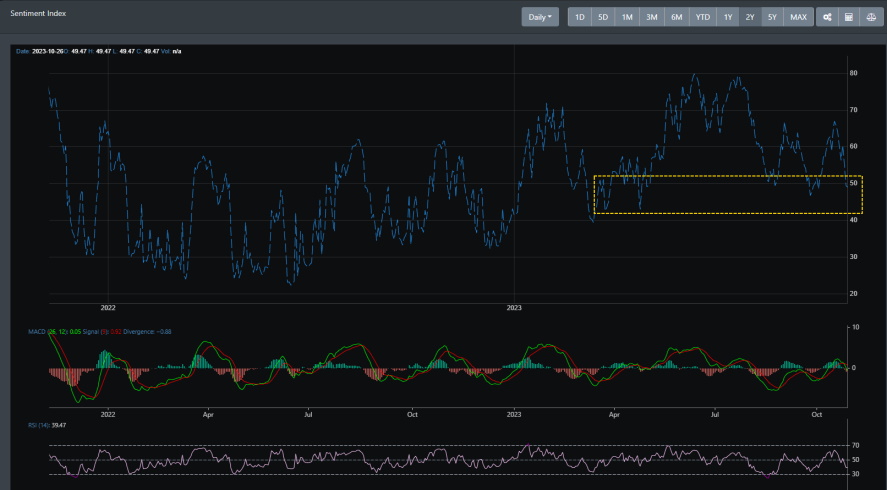
Market sentiment has thus worked its way back down to a near-fear reading. However, for most of the year that saw sentiment reading reach the low end of the 50 levels, there is a reversal of sentiment that goes to the upside. The market sentiment trend data is now oversold on multiple time frames, which typically bolds well for a counter-rally in the near term.
Market Outlook
Since August, all major indices have experienced a pullback, with some indices, such as small-cap, having hit their October lows. Last year, market sentiment spent most of the time oscillating between the neutral and fear reading before reversing and hitting the greed level. And after nearly rallying to their prior all-time highs, it is clear that the markets were due for a bearish reversal. Having hit the October lows set back in 2022, the weekly and monthly timeframes suggested that a reversal was imminent. And a year later, after hitting 78.6% on the Fibonacci levels (from the October lows), markets are now pulling back on the larger timeframes.
SPY
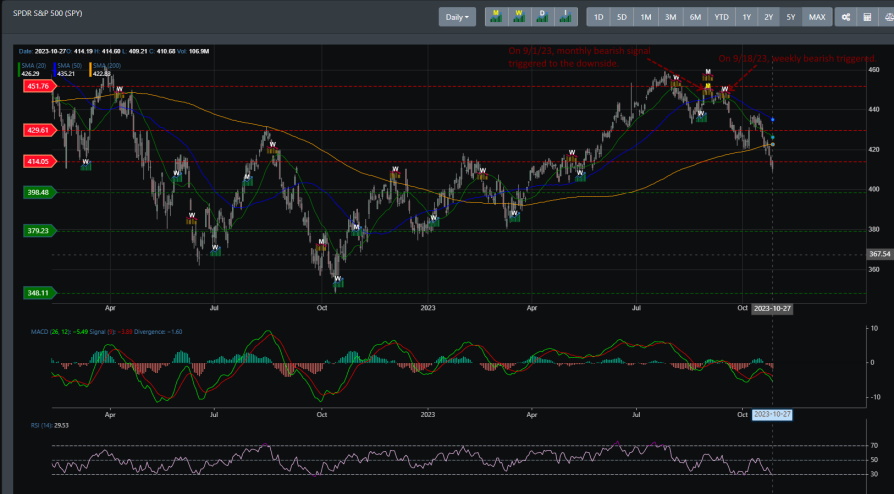
Both the monthly and weekly bearish signals have triggered for SPY, and this does not come about often. The last time that SPY's monthly bearish sell signal was triggered was back on 1/3/22, and with that, we entered the 2022 bearish trend. Having broken multiple supports, SPY is now in a very similar stance to what it was back in early 2022. It closed Friday right under the 414 support region. The weekly and daily time frames are deep in oversold territory.
QQQ
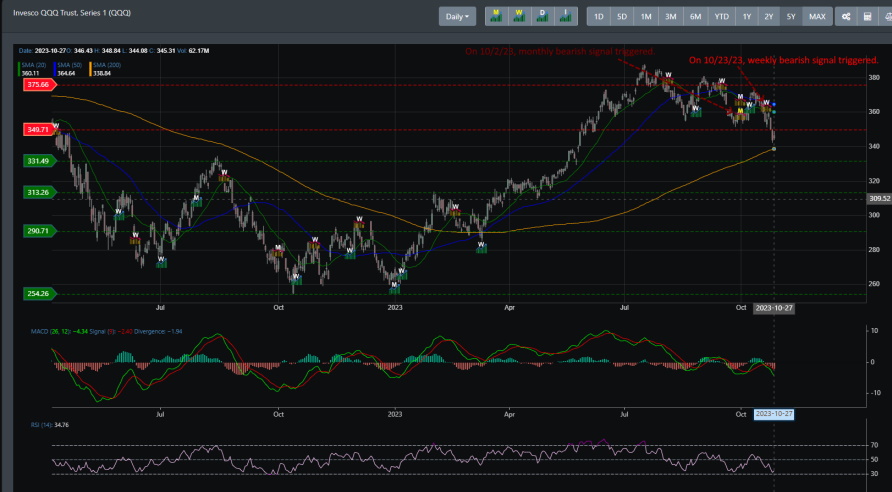
This month, QQQ has posted both a monthly and weekly bearish sell signal. With that, it has broken its two immediate support regions at 375 and 349. On Friday's close, it was trading right under the 349 support region.
IWM
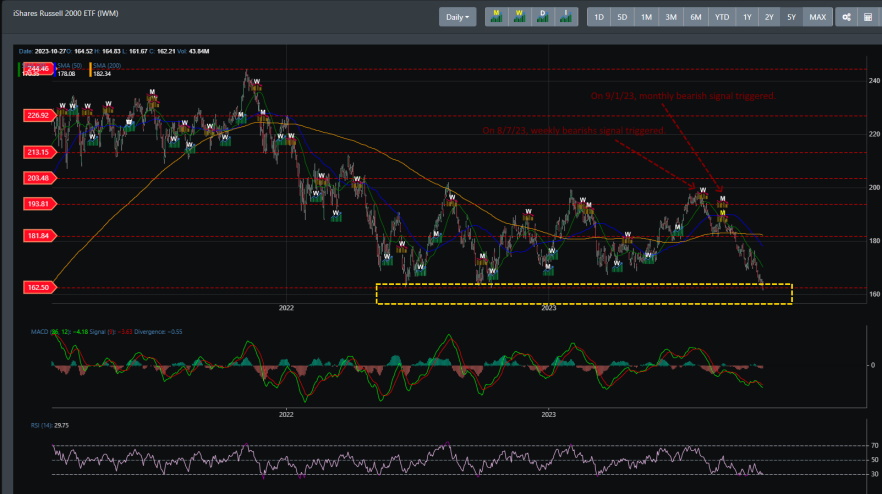
IWM has been in a monthly and weekly bearish signal for the past few months. After receiving the weekly bearish signal on 8/7/23, IWM has broken through support at 181 and is now on the lows set back in October 2022. Support at 162 is critical for IWM and the rest of the markets. A further breakdown of IWM could signal that markets have topped out, and another downside will ensue.
VIX
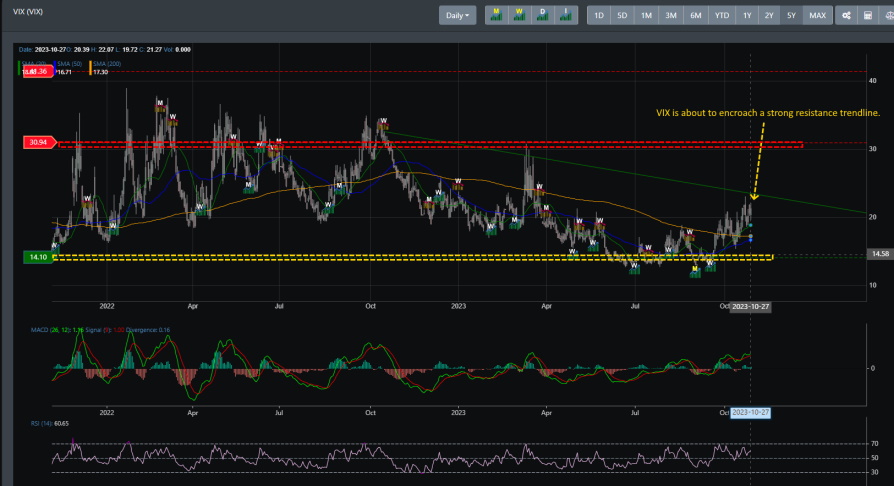
VIX has been trending higher since hitting its monthly bullish signal set back on 9/1/23. At the larger timeframe, VIX looks exhausting, and there are signs that it may be unable to break through to resistance, sitting at 22.71. This could have an immediate impact starting next week for markets as a counter-rally could be gearing up.
Concluding
Markets are at an inflection point. With all major indices closing on Friday under critical support, it is a matter of market sentiment being ready to start a reversal. With the S&P 500 closing right under our support region of 4155, the bulls have to come out and push back above 4155 and maintain support. With the VIX unable to break its near-term resistance and all indices reading oversold on multiple time frames, there is a high probability we will see a counter-rally to start next week. Any further breakdown of the 4155 region could mean markets have finally topped out and suggest we are headed for the 3998 support region. Market sentiment and VIX on the larger time frame have been exhausted, and next Monday looks to be the start of a counter rally for markets.