


By mid-August, most U.S equity indices were looking at +4% gains or more. SPY was up +4.1% and investor sentiment was looking at turning greedy for the first time in months. However, as stated in our last blog on 8/27/2022, we said "With our algorithms issuing a weekly sell signal on the major indices, it looks like there is going to be more downside in the very near term. SPY, QQQ, and IWM have a high potential for a retest of their next support line. This coming week could see the retest of that support."
Markets did go lower to near support the following week. With all major indices entering the week on a 3-week losing streak, the technical picture was deep in oversold territory. SPY momentarily broke support on Tuesday 9/6/22 before the bull decided it was time for a counter-rally.
Big Picture
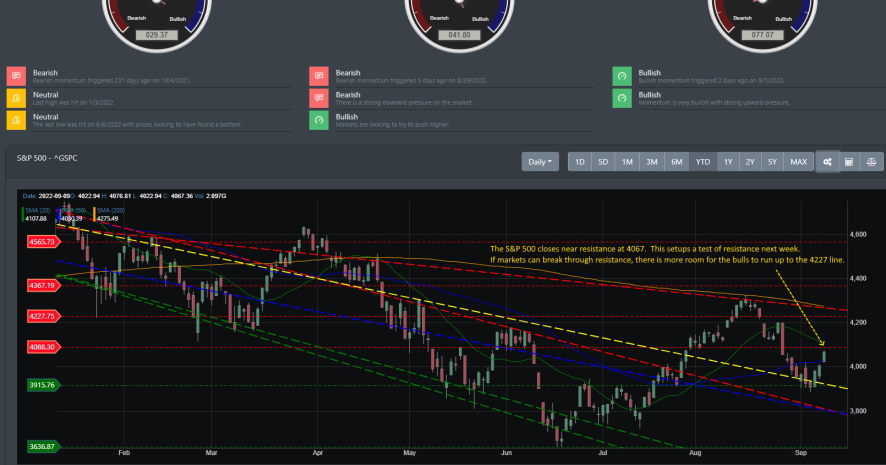
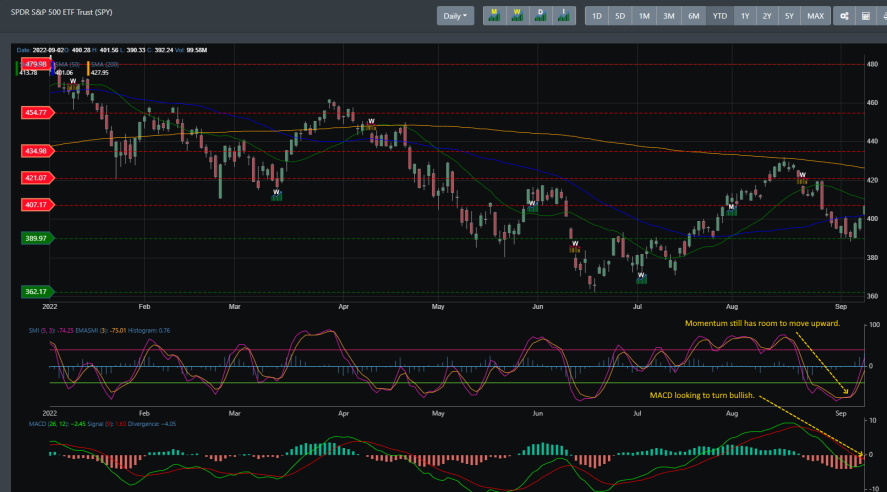
Looking at the chart below of the S&P 500, it is clear from the trend lines that markets have been in a downtrend for most of the year. The red dashed line shows the upper resistance line that coincides with the 200 DMA. The last rally was not able to break through the 200 DMA and since then the S&P 500 price action has dropped to the average support line (yellow dash). With prices settling on support this week, the bulls decided that it was time for a reversal.
Now, prices have closed right near resistance at 4067. Resistance is currently right at 4088.
Market Breadth
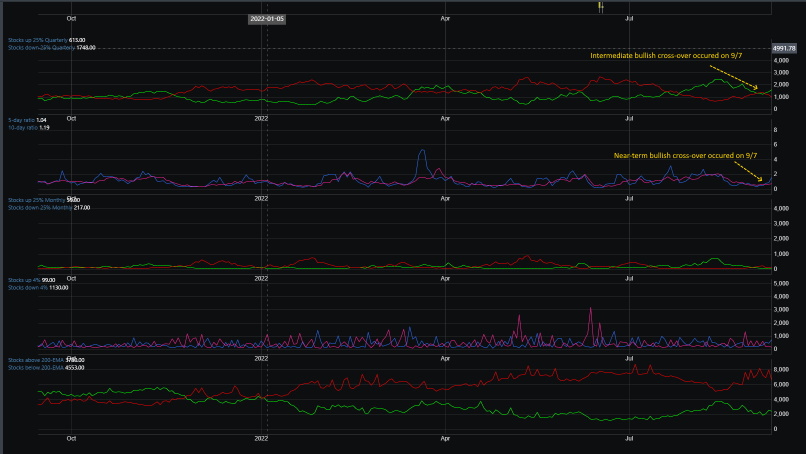
Since mid-August, a pullback has brought market breadth internals back to the bearish territory. Though the last rally had so much momentum that it improved market internals to the point where stocks above their 200 EMA reach a point they have not seen since mid-April.
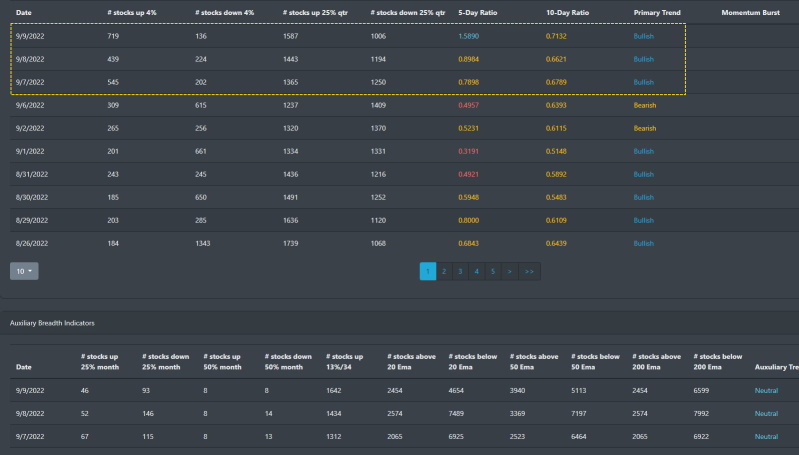
With the current rally this week, the near-term and the intermediate-term signals have turned bullish.
Market Sentiment
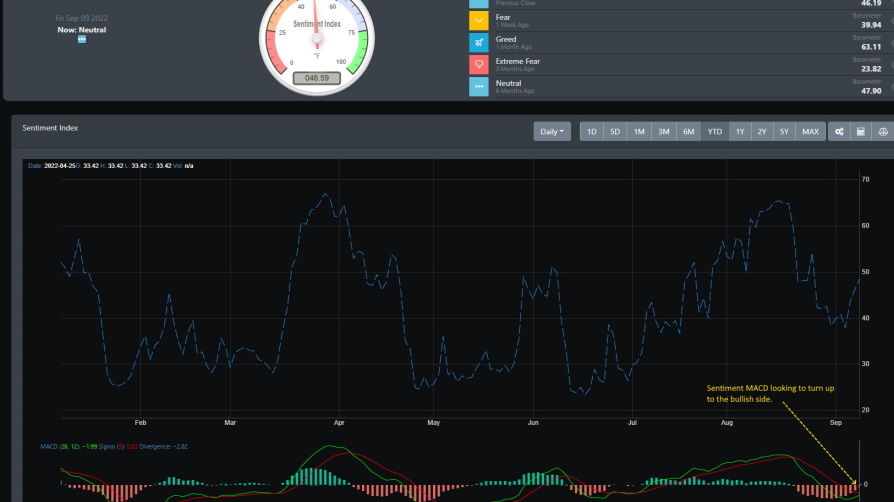
For the past couple of weeks, market sentiment has been settling near the neutral timeline. Only dipping momentarily into fear mode. With the current rally, the MACD for sentiment is now looking like it is poised to cross over to the bullish side.
Market Outlook
The counter-rally is here but near-term technical readings are already in the overbought condition. All technical signals are pointing to a possible change to the upside but if we take a look at the bigger time frame, the weekly sell signal which was triggered a few weeks ago is still in play. There is still downward pressure on the weekly charts that suggest more downward momentum is in store for the markets.
SPY
SPY hit support at 389 on 9/6 and the bulls decided it was time to go all in on the buy. The stochastic momentum still has room to move upward and the MACD is poised to break into the bullish side.
QQQ
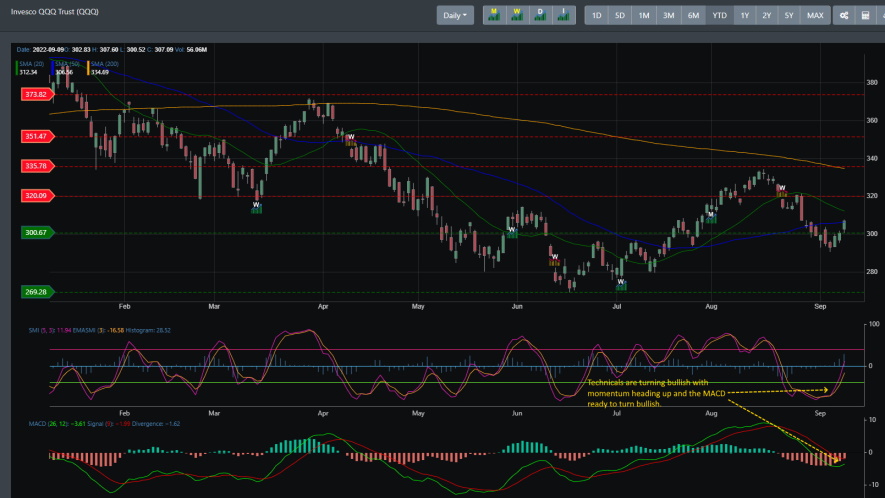
QQQ broke support in early September before turning up to break through resistance at the 300 region. Like SPY, the stochastic momentum still has room to move up and the MACD is poised for a bullish crossover.
IWM
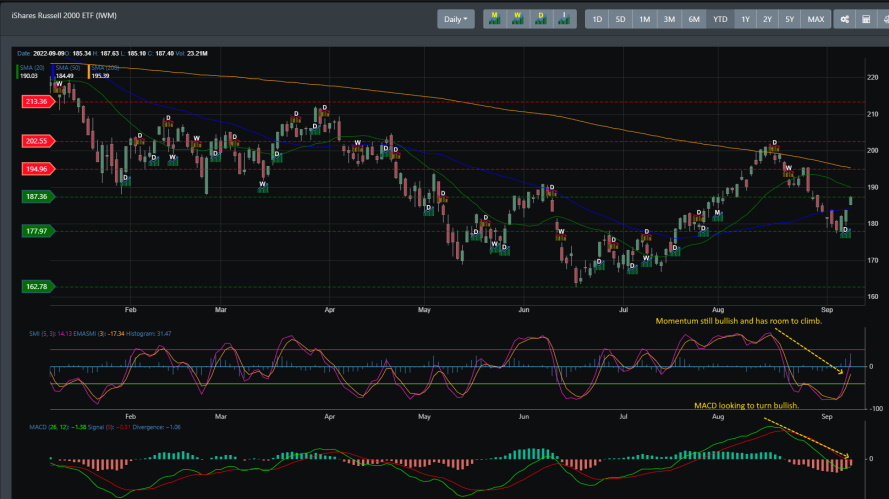
Like SPY, IWM tested support on 9/6 near its support region at 177. And like SPY, IWM is looking to test resistance at the 187 region.
Concluding
The recent rally has set up the indices at a crossroads. With the weekly sell signal still being triggered in late August, there is still downward pressure on the markets. However, the daily readings are now poised to turn bullish and potentially challenge its near-term resistance. If markets are able to consolidate near support and push higher, there is plenty of momentum to push markets higher in the next few weeks. However, if markets are unable to hold and break resistance, there is a chance that markets head lower.