


With earnings season set to wrap up, there seems to be more news regarding an imminent market crash. If you have recently followed some of the market headlines, you would be induced with a bevy of reasons for why a market crash is imminent. Fed tapering, increase in COVID cases, overextended valuations, Afghanistan, inflation, etc. Yet, if you traced some of those headlines, they have been stamped and recycled by market pundits since the March 2020 lows. And if you were one to stay on the sidelines or hedge by shorting the market, you probably have ended up frustrated or losing out as markets have been making all-time highs.
Now, with the recent pullback, there is more forecasting by market bubbleheads as to why the market is set up for a big correction. Though we do not agree that the market is ready to crash, we are seeing some signs in our market breadth reading that is indicating a stronger pullback is potentially underway. We showed back in our prior blogs that every pullback that has occurred since November 2020 has been shallow and quickly bought up by the FOMO crowd. And this year alone, every dip that occurred was met by bulls pushing up on the 50 DMA line.
Big Picture
At BullGap, we follow price action movement. And those movements on the monthly, weekly, daily, and intra-day reflects the current market sentiment at that point in time. Right now, the bigger time frames are still in a strong uptrend. But there is a weakness currently that has been hitting the market and it is creeping up within the market breadth readings.
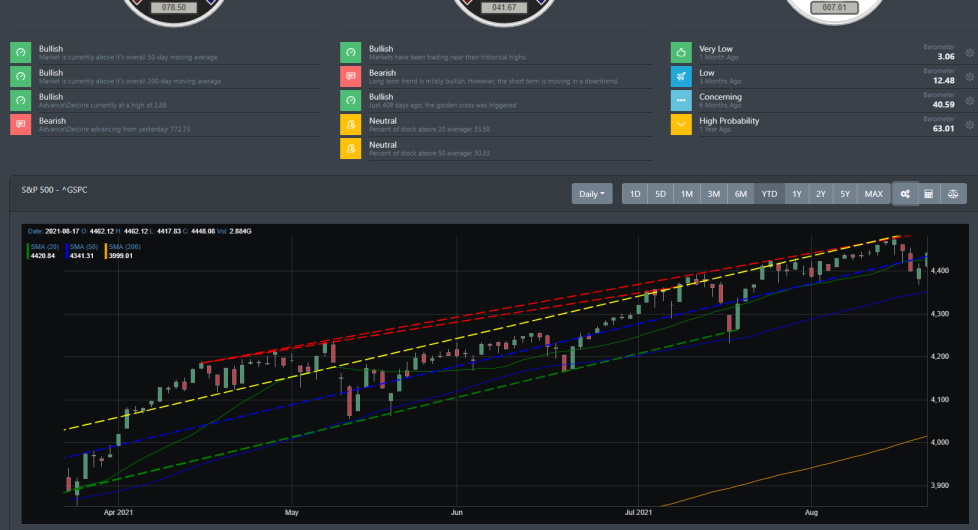
This week markets started the week with a pullback that dropped the S&P 500 to a low of 4382 on Thursday. While this was occurring, the bears were coming out ready to claim that the market sold on fear of Fed tapering or because of the delta variant. No sooner than the bears were patting themselves on the back that the market tested support above the 50DMA and begun a rally to close out Friday. If you look at the chart below, you will see several occasions where the market dip near the 50DMA and was immediately bought up by the bulls.
Market Breadth
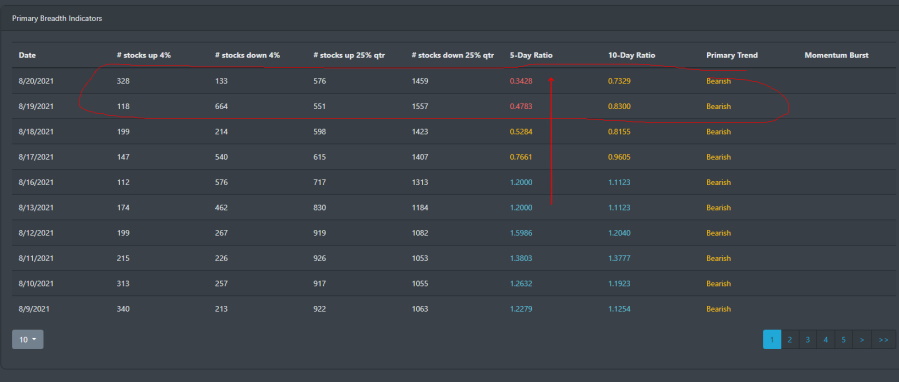
Even with Friday's counter-rally, market breadth is showing deterioration. And unlike the dip-buying that occurred since November 2020, this recent bounce back does not seem to have any backbone to it. Like previous data points in the past, when the 5-day and 10-day ratios are reaching a bearish state, we can expect a potentially deeper pullback.
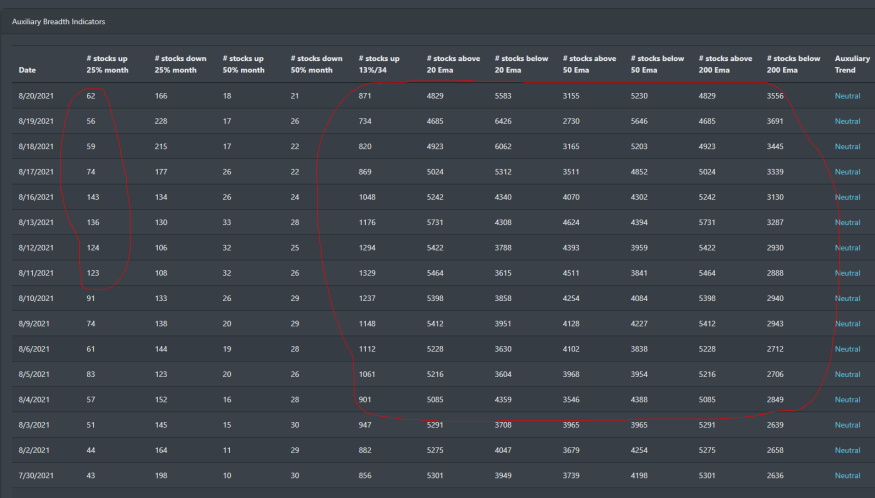
Looking at our secondary market breadth data, we are seeing a pattern now where the overall strength in the market is deteriorating. Stocks above their 20 EMA, 50 EMA, and 200 EMA are gradually on the decline while the number of stocks below their 20EMA, 50 EMA, and 200 EMA are increasing.
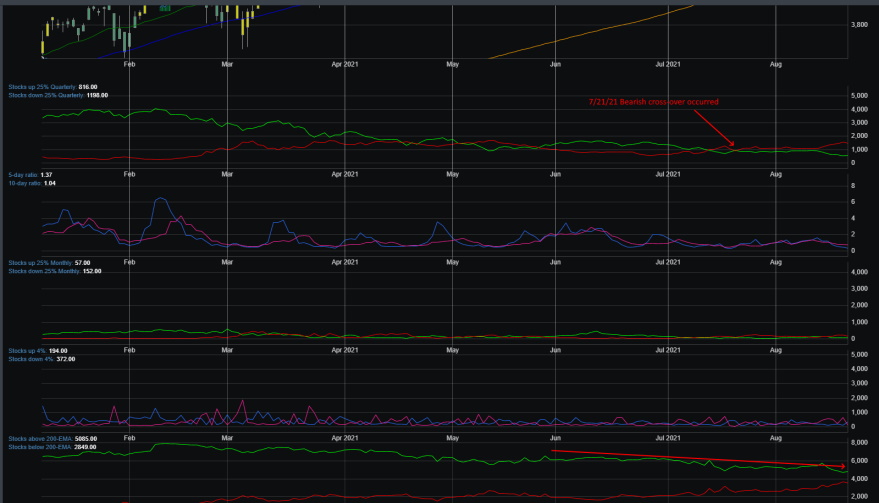
The bearish crossover which we discussed in our recent blogs occurred on 7/21/21. While the equity market has been making new all-time highs since the bearish trigger, this clearly is a bearish divergence that has now legs. The recent pullback this week may be a sign of a bigger market dip. Friday's counter-rally may just be temporary as we are seeing more breakdowns in the near-term trend.
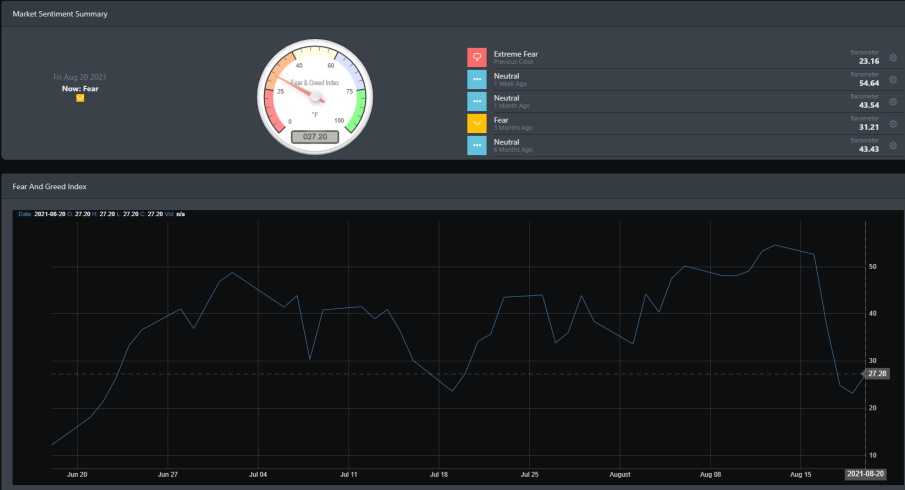
Market Sentiment
Market sentiment is now in "Fear" as the index hit a low of 27.20. There may be potential for a reflexive rally early this week as is historically when the market index dips this low during a bull market. However, with the current market breadth reading that is currently underway, that may be short-lived and is limited potential to the upside.
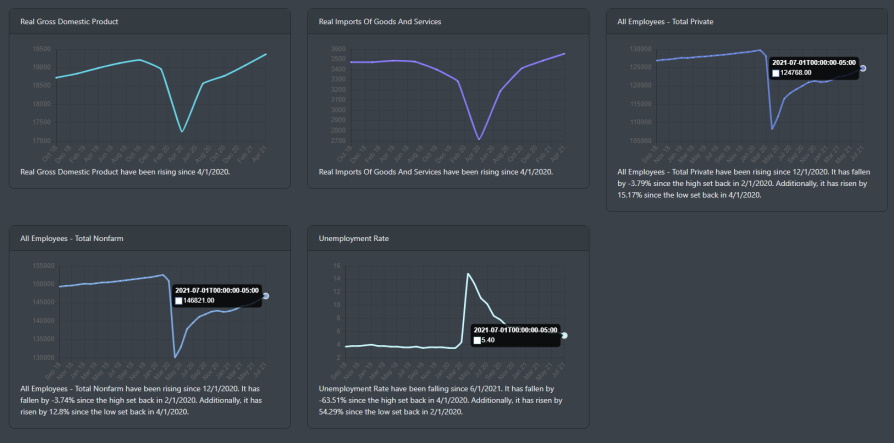
Economic Outlook
As discussed in our prior blogs, economic data is showing expansion. However, even with a strong housing market and growth in new orders, the labor market has been the Achilles heel for the economy. Only until recently has the unemployment rate start to decline. And currently, All Employees (total private and total nonfarm) are still well below their pre-pandemic levels.
Market Outlook
Markets are currently in a bearish reading with the recent selloff starting last Monday. On Friday, equity markets did make a counter-rally but will it be similar to the ones we have seen for the past 6 months? Let's look at the charts on the weekly timeframe.
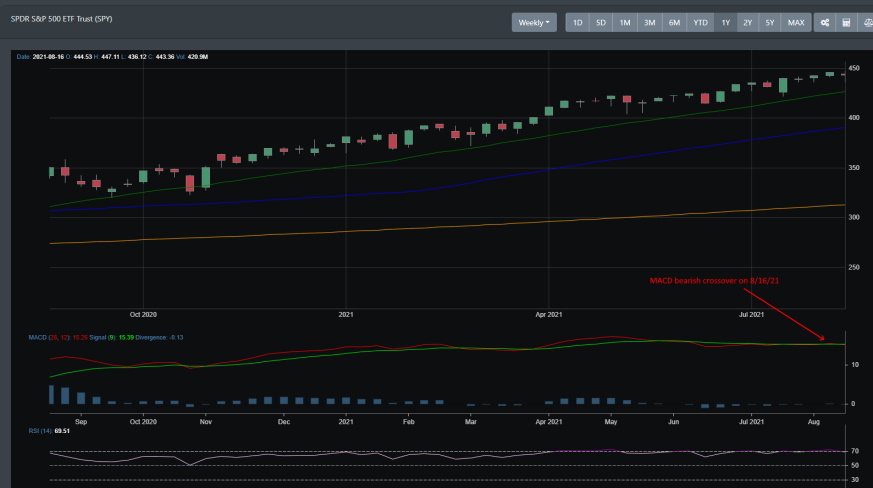
SPY
SPY has clearly been in an uptrend since November 2020. It did hit a road bump in late February but found its stride at the end of March. The weekly MACD bearish cross-over hit on Monday and this is where we are seeing the drop in the market.
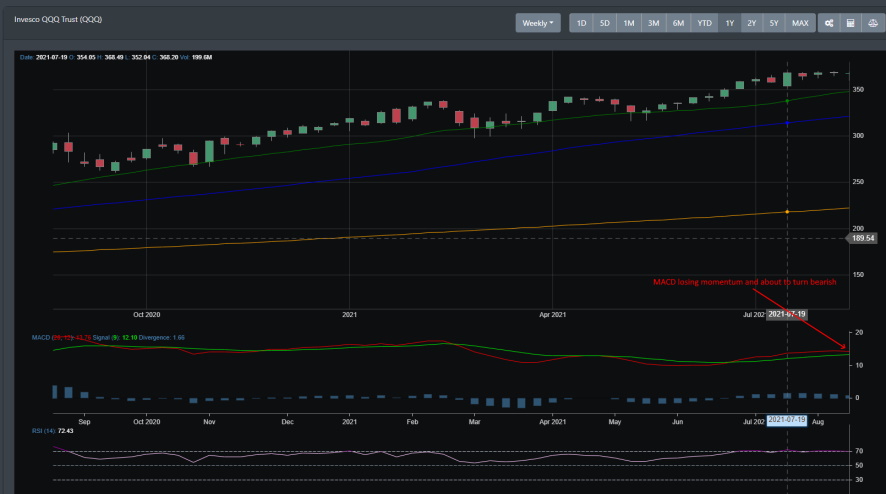
QQQ
QQQ has had a strong run since late May and right now it is looking to lose some of that momentum. The MACD is losing upward momentum and looks potentially ready to cross over to the bearish side.
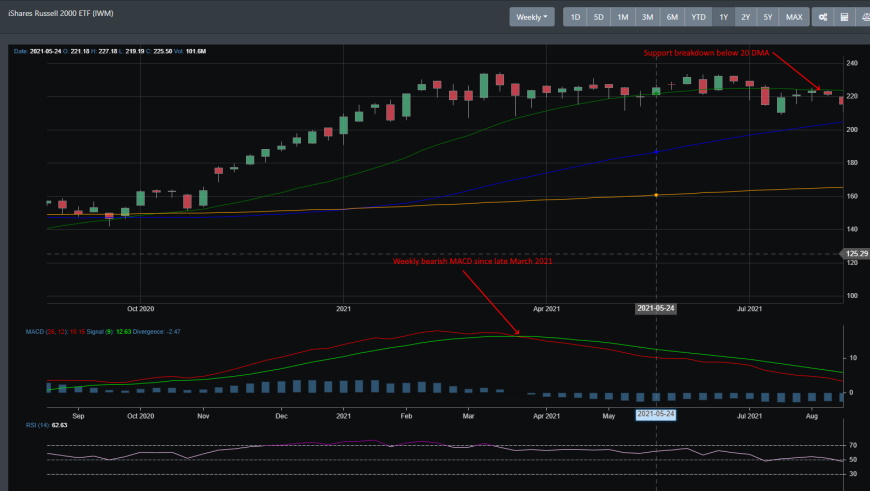
IWM
Small-caps clearly have been on the downturn since late March of this year. Since hitting its weekly MACD bearish cross-over, IWM has been trending sideways. However, the last week it broke through support and is currently below the 220 reading.
Concluding
The S&P 500 close around 4441 and has since doubled from last year. The S&P 500 is less than one percent from its high but the markets are currently in an overbought condition. All major indices such as S&P, Nasdaq, and DIJA are in overbought conditions while the IWM is trending lower. Though we see market breadth weakening, it does not mean that this bull market is ready to collapse anytime soon. There is however a good chance of a dip near the 4200 reading which will relax the overbought conditions.