


January is in the books, and U.S. financial markets have kicked the bears into hibernation. With such an eventful week on Wall Street where, the Feds, Bank of England, and European Central Bank all but raised rates with the backdrop that inflation has peaked and is subsiding. The stock market has continued its rally to close out January, with the S&P 500 clocking in at +4.65% and the Nasdaq Composite gaining almost 9% for 2023. The move from value stocks back to growth stocks is taking hold as the Dow Jones Industrial Average advanced +1.7% for January.
And as we stated in our last blog, "The technical readings are in right now, and all signs point to markets gearing up for a push higher, with the S&P 500 ready to potentially hit its golden cross-over this week or next." That statement was posted back two weeks ago when markets had a pullback. At that time, the bear crowd was clamoring and suggesting that the current rally was just a bear rally that would take us back to October's low. Our blog suggested otherwise, and we saw this moment as a consolidation period emphasizing more room for markets to push higher.
And it just so happened that now we have several bullish indicators in play.
Big Picture
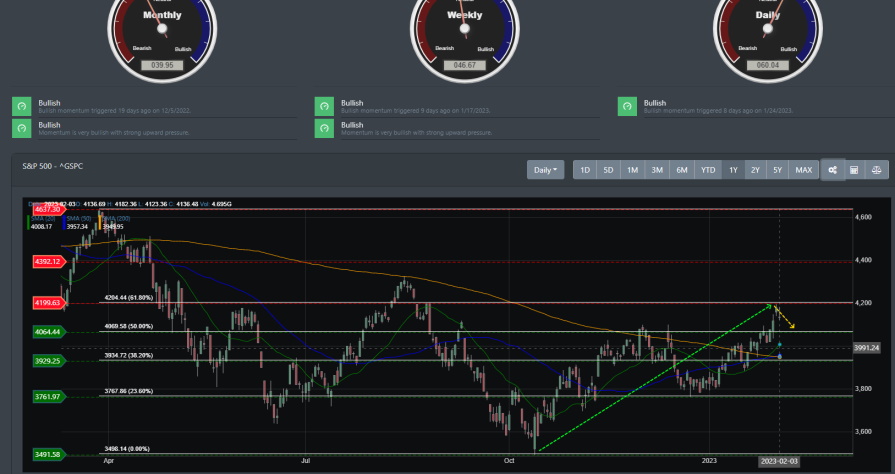
Since hitting the October 22 lows, markets have pushed higher to break through to several key resistance lines, as illustrated in the image below. If you follow our blogs during that time, you will see where we identified a vital technical setup that foretold a new bull market. Additionally, before the S&P 500 broke the 4064 region, we highlighted areas where it failed in the past few sessions. These past two weeks have seen the S&P 500 surge to challenge its next resistance near the 4200 region. We also stated in our last blog that we were seeing a potential bullish technical setup forming. We quote:
"SPY is looking very bullish now. With both the monthly and weekly bullish signals being aligned, there is good reason to see SPY potentially challenge its golden cross over this week. The current pullback is forming a consolidation pattern. However, the intraday readings suggest more room to move higher in the coming week."
On the heels of Powell's comment that inflation has subsided, the S&P 500 completed its golden gross, where the 50 DMA crossed over its 200 DMA. A clear bullish setup for not just the S&P 500 but for the markets as a whole. The last time this technical setup occurred was back in July 2020, when markets rallied higher to the end of 2021.
Market Breadth
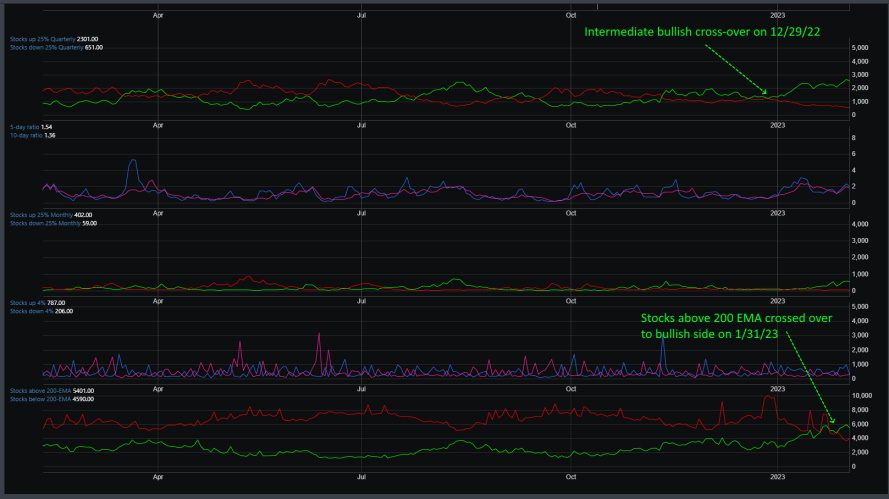
Heading into the end of 2022, market breadth internals from improving but had a look that they were ready to turn over to the bearish side. That all changed when the 5-day and 10-day ratios of stocks up 4% for the day versus stocks down 4% for the day triggered on 1/12/23 and again on 2/2/23. Another strong indicator is stocks above\below their 200 EMA. This week, this indicator broke out to the bullish side. This had not occurred since November 3, 2020, when markets rallied higher to close out 2020.
With the intermediate bullish cross-over of stocks up\down 25% quarterly, the bullish burst signal being triggered, and 200 EMA of stocks up and down, financial markets are on solid footing. The probability of hitting October's lows is doubtful.
Market Sentiment
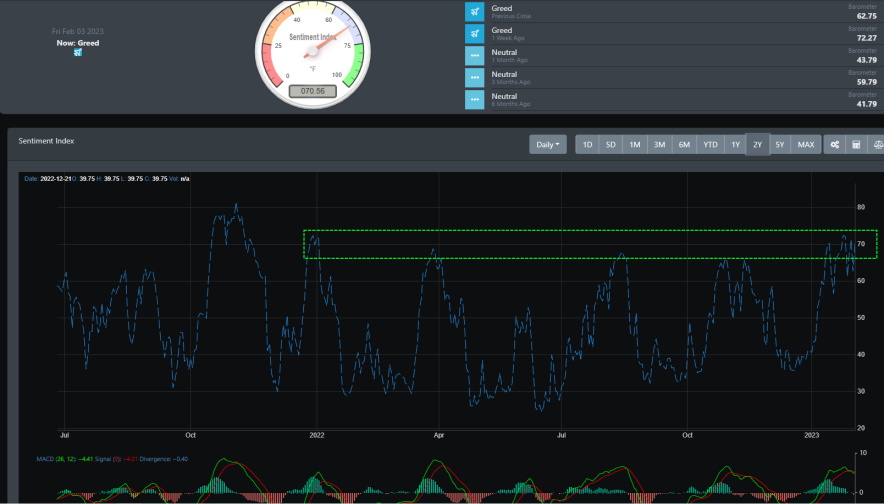
Market sentiment has been in greed mode for the past couple of weeks. In a couple of weeks, sentiment reading has gone from the 40 lows (near fear reading) to a near all-time high of 72.36. Looking at the past two years of our sentiment data, it is clear that when near-term sentiment reaches this level, it usually reverts to the lows. This current setup suggests that a pullback could be in store for the coming week.
Market Outlook
The bulls have the sails on their backs, with the technical picture suggesting that the bull market we discussed in October of 2022 is gaining ground. Additionally, this week's improved job report showed over 517K jobs created. With inflation slowing and a strong labor market, this has a trickle effect of putting pressure on rising wages. This directly impacts the demand for goods and services, increasing prices. This week's job report puts a dent in the brutal recession fear many market pundits are calling for.
SPY
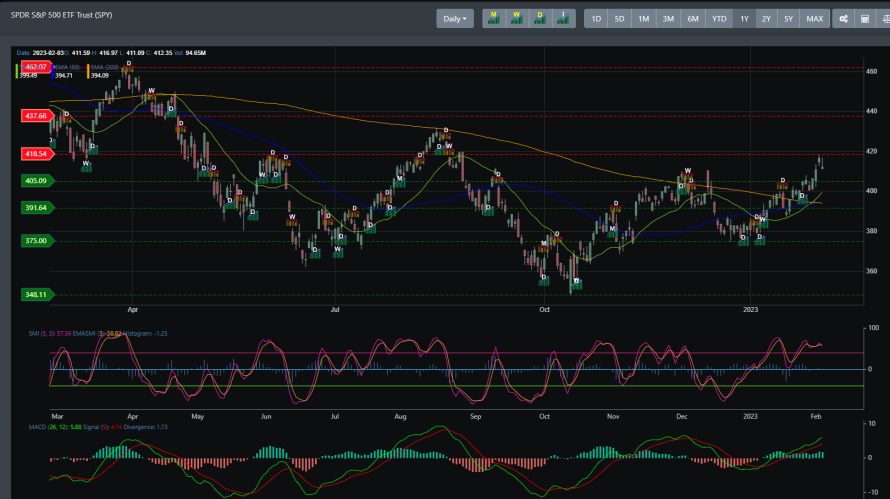
If you are on the bull camp, there is nothing not to like about the direction of SPY. SPY has rallied to challenge resistance near the 418 region with the monthly and weekly bullish buy signals intact. Support is at 391, where it could start to consolidate if a pullback occurs this week or next.
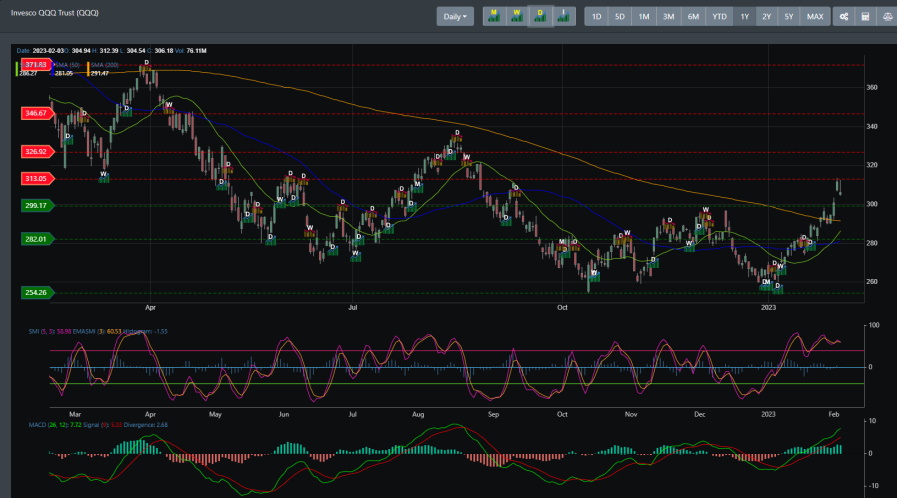
QQQ
QQQ has been on a tear since its monthly and weekly bullish buy signal triggered in early 2023. It broke through several key resistances before being pushed back near the 313 region.
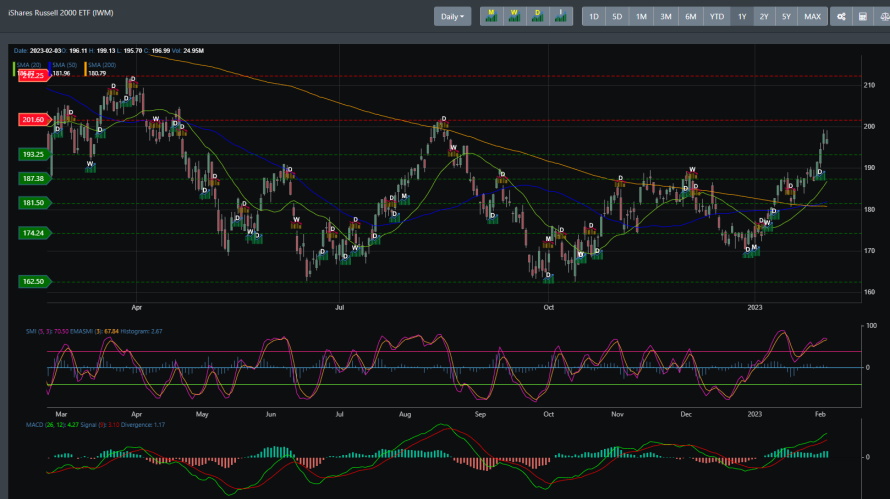
IWM
IWM has been the catalyst for the market rally. Moreover, it has been the forerunner of the rally since hitting the October lows back in 2022.
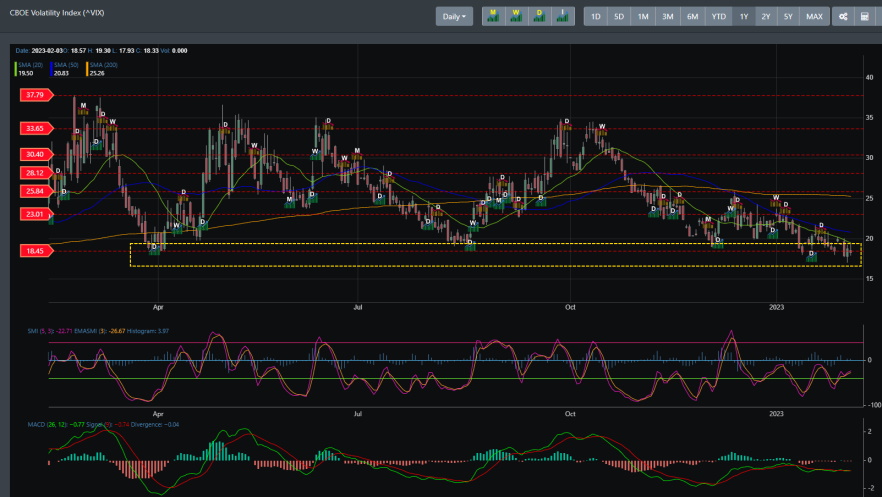
VIX
The CBOE Volatility Index (VIX) right now is hovering below 20, which has shown to be near the bottom since the start of the COVID induced crash of 2020. For the past year, when the VIX has hit this bottom, there is an immediate, reflexive bounce which causes market rallies to revert. There is potential for this to occur, but given the nature of the solid technical landscape, any pullback may be shallow. However, if the VIX continues this trend of modulating under the 20 level, there is a good chance that markets will rally higher.
Concluding
A tailwind of a robust technical setup has the bulls grinning ear to ear. That said, the near-term overbought conditions suggest a pullback is in store. Support is near the 4064 region. However, even with overbought conditions currently in play, the technical setup still has room to run. If markets continue to hold support, then we may be having a discussion about the 4392 region in our next blog.