


In a span of fewer than 6 months, the S&P 500 went from hitting daily all-time highs to being down nearly 20% from those highs. Markets have been in a downtrend for much of the year. In fact, this year alone has seen the worst starting performance for both the Russell 2000 and Nasdaq. Both have declined by over 20%. And with the inflation running to multi-decade highs, supply chain constraints, FED ending QE, and consumer confidence falling - investors have a wall of worry when trying to navigate the current market landscape.
With many declaring the market in bear territory and the S&P 500 touching below 20% on the year, there has been plenty of news outlets calling for the market to drop down to the 3600 region. Where are the bulls? Is it just all bear now?
Big Picture
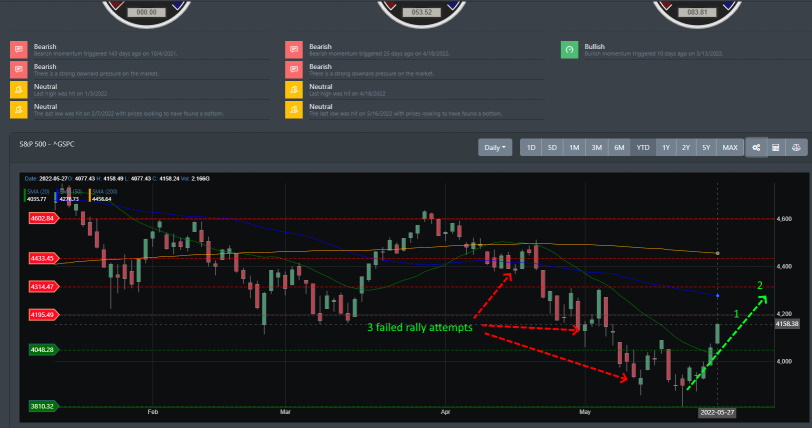
It has been a while but the market is rallying right now. After a sloppy beginning on Monday and Tuesday to start the week, all market indexes rallied to break through their near-term resistance level. The S&P 500 posted a +6% gain for the week and ended its 7-week losing streak. Even DIJA's ended its 8-week losing streak. All major indices posted +6% gains for the week.
Looking at the image below, we can see that this rally is unlike the past 3 rallies before it. The last 3 rallies were short-lived (1 to 2 days) and saw the index break support and move lower. This rally clearly has a high potential for moving higher in the next week or two. There are 2 green numbers in the chart that shows the next resistance levels for the S&P 500. Green 1 resistance is at 4195 and with the current market momentum data, it looks like the index will blow right through this resistance zone. The next level of resistance is at the 4314 region. If markets can hold and maintain the first resistance (Green One), markets have a good chance of challenging 4314 region in the next few weeks.
Market Breadth
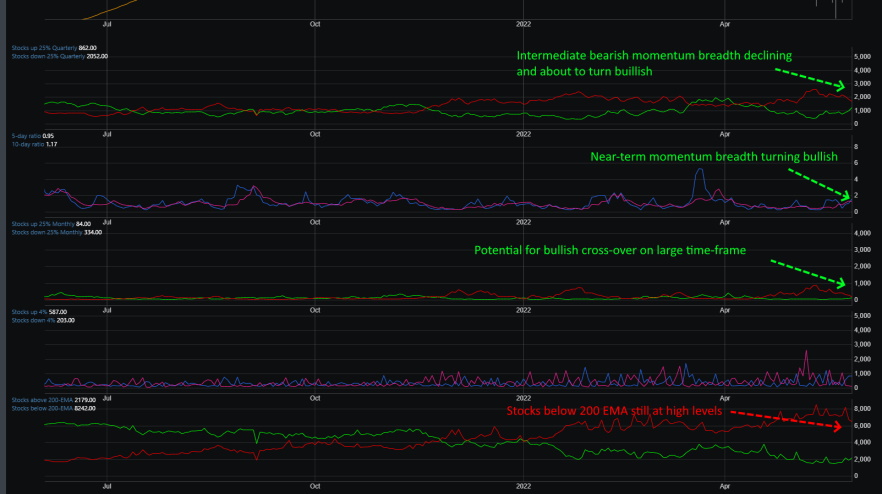
As we speak, market breadth data is slowly turning bullish. Though stocks below their 50 and 200 EMA are still historically high, the near-term momentum is ready to turn bullish. Looking at the image below, we can see that the near-term and intermediate data shows bullish cross-overs that support the current rally we are in. The last 3 rallies before it did not have this signature.
Market Sentiment
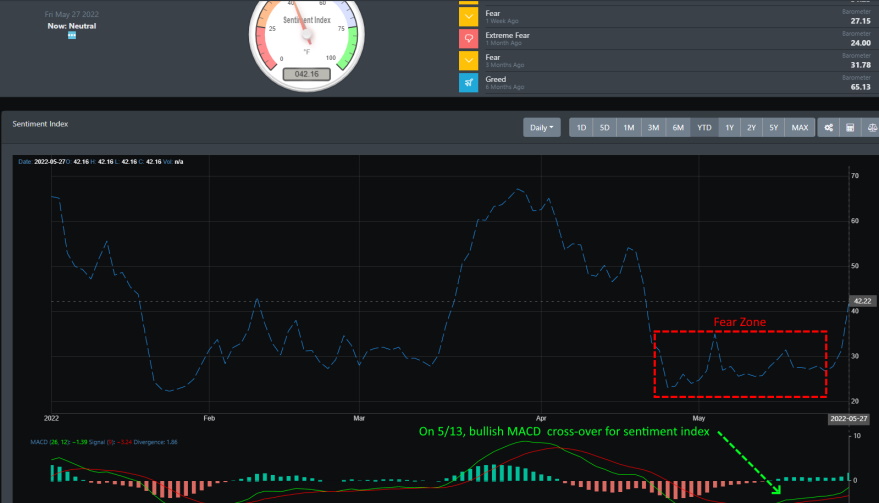
The sentiment landscape is just abysmal. For the past 3+ months, BullGap's sentiment index has been in the fear territory. You can see that in the image below with the "Fear Zone" outlined in red where May has been a no man's land for bulls. However, the MACD did turn over recently and it has slowly started moving in an uptrend. With the sentiment moving from fear to now neutral, the rally started to commence.
Market Outlook
A bottom has been forming for the past couple of weeks. While market sentiment has been downright scary, it has been slowly ticking up. As noted in our prior blog, markets are in a downtrend. For most of 2022, BullGap's trend finder has been showing all market indices (from a timeframe perspective) are in both a monthly and weekly downtrend. That has changed this week and the Russell 2000 again is leading the charge.
SPY
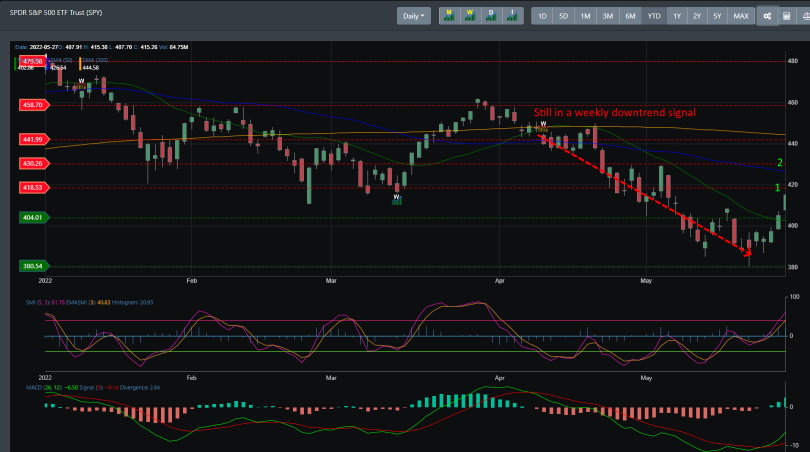
SPY is in the confines of a monthly and weekly bearish downtrend. It has been trending lower since the start of the year when the monthly bearish signal was triggered. This week has been a strong note for SPY has started a rally that broke through the 404 resistance area. With momentum still gaining, there is a high probability that sPY breaks through its next resistance at 418 and challenges the 430 region in the next week or two.
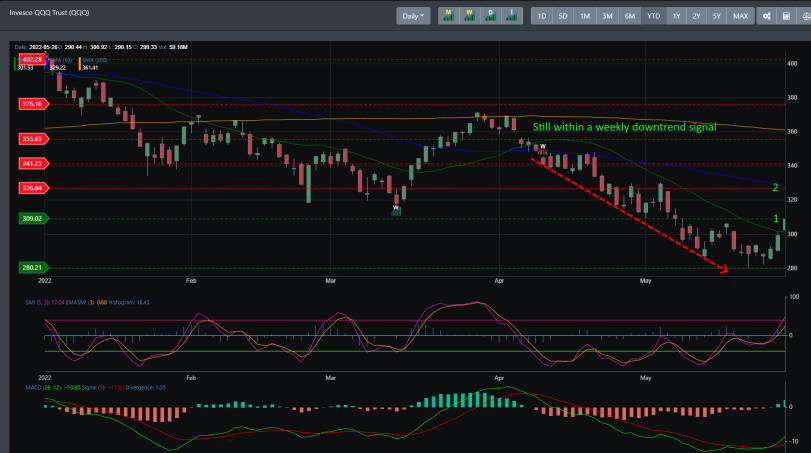
QQQ
Like SPY, QQQ is also in a monthly and weekly bearish trend. And again like SPY, QQQ is rallying now and will challenge its immediate resistance near the 326 region. If it can hold and find support at 326, it still has the momentum to attempt the 326 region.
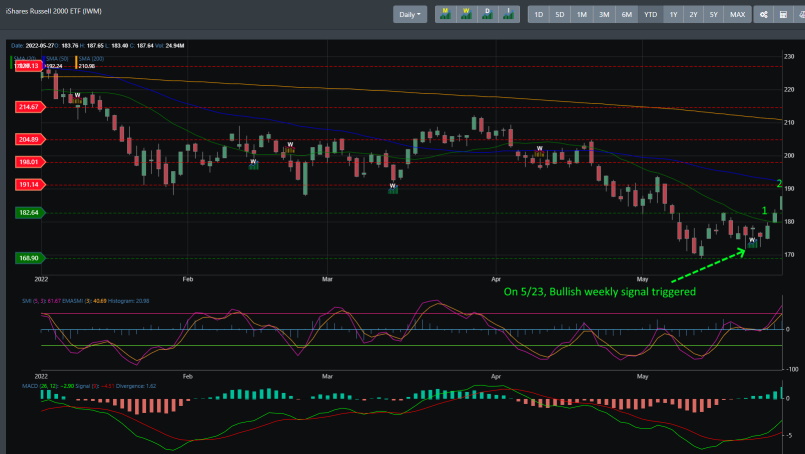
IWM
The bullish weekly signal for IWM was triggered on 5/23 this week. Off this trigger, IWM was able to easily push through its first resistance at the 182 region. It is now looking at challenging the 191 area in the next week or two. It is the only major index to post an intermediate bullish trend.
Concluding
Markets are now rallying. With recent hedge funds such as Melvin Capital wrapping up their heavy selling and closing shop, major sellers in the market are becoming a few and far between. This current rally has a strong potential to send markets back north. With the IWM signaling an intermediate bullish trend and with market breadth internals ready to cross over to the bullish side, this rally has strong support. IWM is a strong leading indicator of direction for the market. Similar to when the bullish trend signals triggered for IWM on 10/18/2021 and 11/9/2020, it was a signal that helped propel markets higher.