


Markets had the strongest gain of the week for the entire year. In fact, the S&P pushed higher to its best weekly performance of the last 12 months. The S&P posted a +6% gain, Nasdaq was the winner with +8.5% and the Russell 2000 moved higher +5.3%. In our last blog on February 27, 2022, we said the time was now to buy on the dip. And we ended with the following note:
"With our market sentiment in fear mode since January and short-term market breadth moving in the bullish direction, there are technical readings now that suggest the bottom has been struck"
Over 2 weeks have passed since that blog and there was plenty of market pundits and market analyst suggesting that the market was ready to drop even further. And within this 2 weeks time span, the market never dropped below the week of Feb 27. It, in fact, consolidated and found support. With all the news of the Russia-Ukrainian war, Covid outbreak in China, oil rallying to new highs, nuclear threat and fed raising rates, the news outlet grasp onto any bad news that would suggest the market was ready to drop lower. The news apparently does not move markets as many would have you believe.
Big Picture
Before the Russian invasion, investors were getting hit by news outlets suggesting inflation will tank the market. They also got another round of fear when Russia invaded Ukraine. And yet, when Russia invaded Ukraine, the market bottom and now is more than +325 points off that low. Surely, inflation and war would have compounded the issue and moved markets lower. However, that has not been the case and price action as of late has been quite bullish. On Monday this week, markets could not continue the short-term rally from the week before. Like the other rallies of the past month, it faded and consolidated. However, Tuesday saw a turnaround as markets started moving higher and by the end of the trading week, the S&P rallied for 4 consecutive days to post a +6% gain. Nasdaq propelled even higher and small caps which is a reflection on the economy saw a sizeable rally as well.
Market Breadth
As we noted for a few months, market breadth has been weakening since late last year. It has been "consolidation" and as such market volatility typically is the norm in the present condition. The outline in yellow shows the dates where market volatility was the norm. However, breadth internals started stabilizing and the near-term stocks that are up 4% started moving higher. The 25% stocks up\stocks down also started trending in the bullish direction. On 3/18/2022, markets closed with the 5-day ratio above the 10-day ratio - a strong sign of a near-term bullish movement in the market.
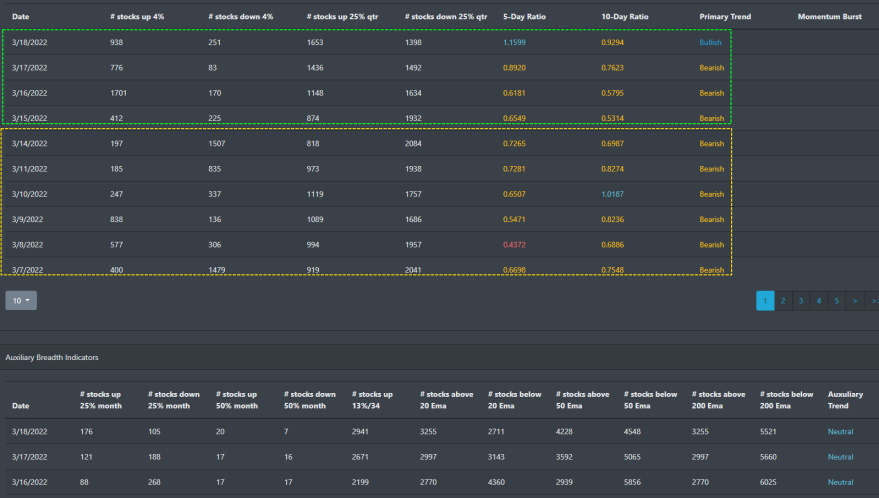
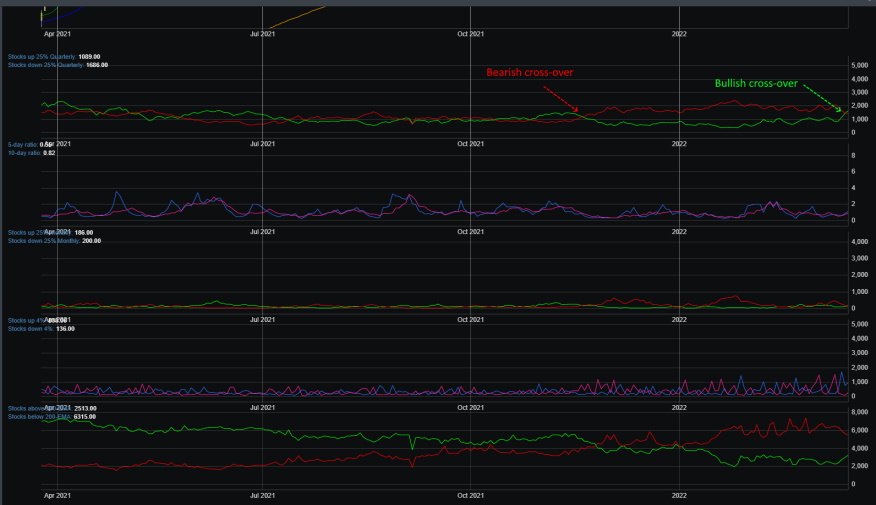
Historically, when the 25% stock up\stock downturns bullish, there is a high probability that markets are moving higher. If we look at the chart below, markets have been in the red since November 2021. We just had a first cross-over on Friday.
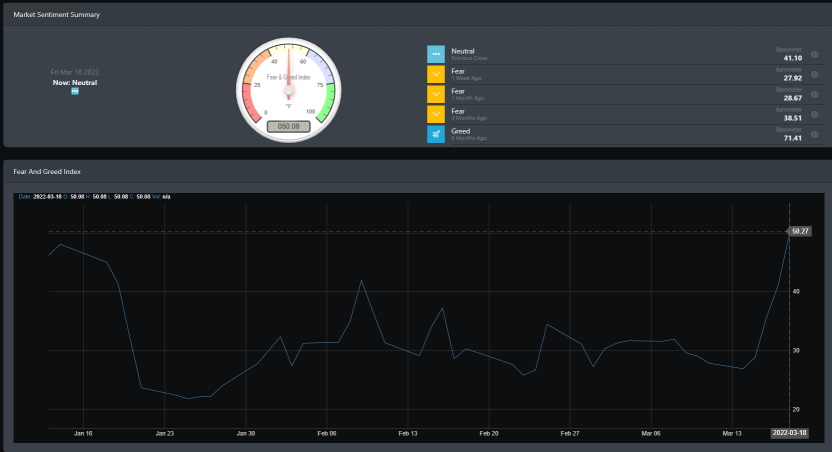
Market Sentiment
Fear has been name of the game for the better part of the year. Markets have been averaging around 30 on the BullGap sentiment index and historically that suggests markets have entered a consolidation phase. Unlike the March 2020 crash, the current market correction has been controlled with market participants selling in a more "order" fashion. For the first time this year, the market sentiment reading broke above the 50 point reading.
Market Outlook
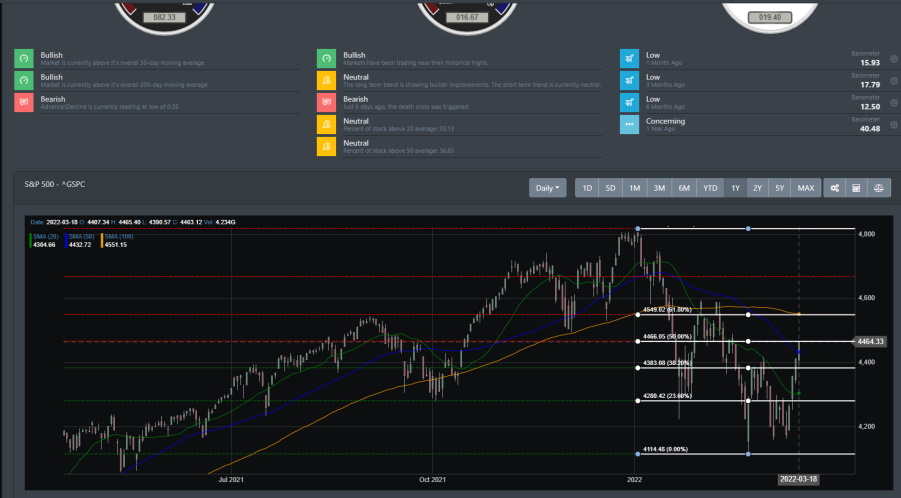
Markets rallied this week and broke through their short-term resistance to now challenge their 200 DMA and 50 DMA. Unlike prior counter-rallies this year, the past 4 days saw markets participants help push the indices higher with little selling to break the trend.
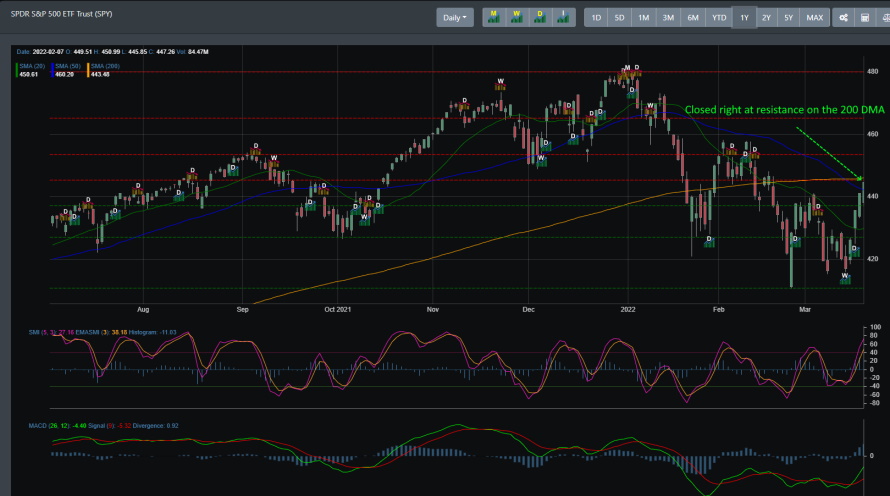
SPY
If we look at the chart below using our TrendFinder algorithm, we can see that the Weekly Buy signal for SPY was triggered on 3/14/22. For SPY, when a weekly signal fire, it is a strong indicator of a sizeable rally. With that signal, markets rallied higher to close out the week. SPY closed out this week just right at its 200 DMA resistance.
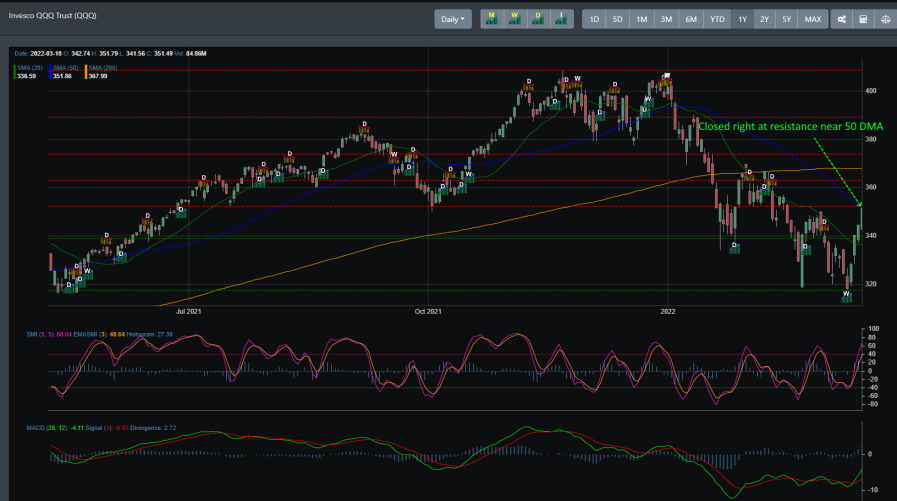
QQQ
Like SPY, the weekly Buy signal for QQQ was triggered on 3/14/22. And like SPY, when the weekly buy signal triggers for QQQ, it is a sign that a strong rally is about to start. Now, the growth-beaten indice has the best performance for the week and is looking at challenging the 50 DMA next week.
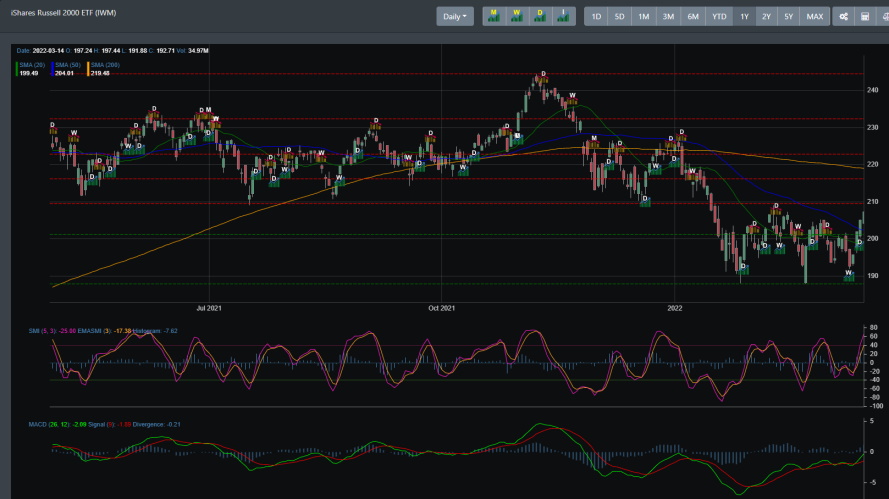
IWM
IWM also triggered its weekly buy signal on 3/14/22 and also rallied for the week. IWM rallied to the point where it pushed over its 50 DMA and now is sitting at resistance near the 207 region.
Concluding
Rising inflation, war overseas, oil prices surging for the past couple of months, and uncertainty seem to be the major topics for most investors. However, if we take a look at all of these negative news that suggest how each one of them would drop the market, we would have been staring at the S&P 500 in the 3500 markers. Even during the 2020 covid pandemic, there were plenty of news pundits coming out suggesting that the market would drop to its lowest in decades. And as we have been stating for a few years now, this bull rally is still intact. With our technical readings turning bullish, we see markets pushing higher this year. In the near term, markets this week will have a test of resistance.