


Last week we mentioned that BullGap's Momentum Market Timer issued a sell signal a few weeks earlier and that the equity market was looking at a minor dip (not a major correction). On Monday 7/19/2021, that came to fruition as the S&P 500 dropped almost 3% before FOMO kicked in high gear. If we look back at last week's blog (7/18/2021), we stated below:
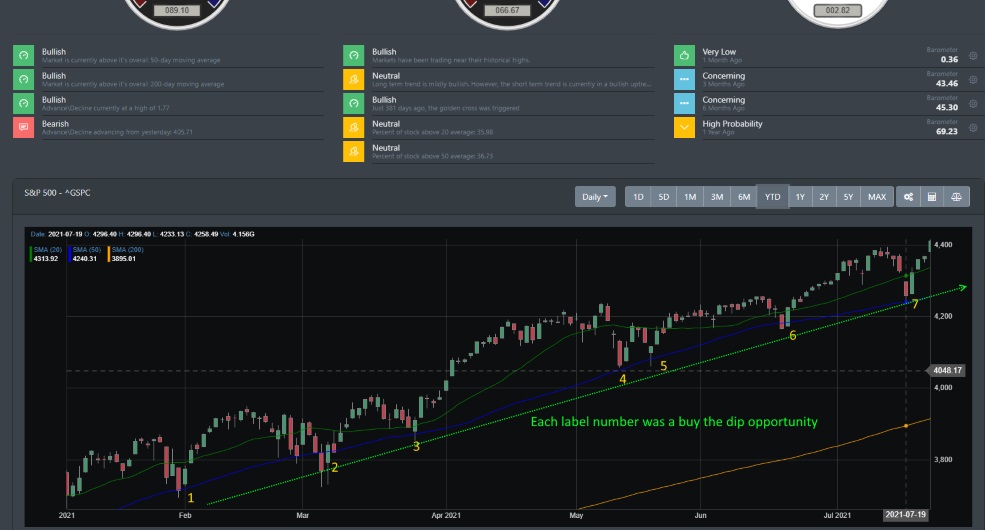
"Looking at the Big Picture image below, we are expecting the market's next test to be around the 4309 marks (20 DMA). If the market holds at this point, we expect the market to push onward to our projected region of 4400-4500. If support breaks, then we expect the next support line will be tested near 4239."
On Monday, the dip occurred where the S&P 500 did test support at 4233 (right around our suggested 4239 support line). As as we discussed in our last blog, this would be a buying opportunity if this support was held.
The interesting item from Monday's dip was not the dip buyer but the noise generated from Monday's scare. Market pundits and financial news outlets were calling for an end to the bull market and that the COVID delta variant will drop the market further. Sounds like deja vu all over again. In February, these same experts were calling that the Nasdaq is overdue for a major correction. All throughout this year, many of those same experts were using inflation worries as the next reason for a stock market crash. If you were following these market pundits' advice, then you would have missed out on all the golden opportunities as the S&P 500, Nasdaq and Dow are all at all-time highs. As we have stated many times in our prior blogs, markets started consolidating earlier this year from the massive rally of 2020.
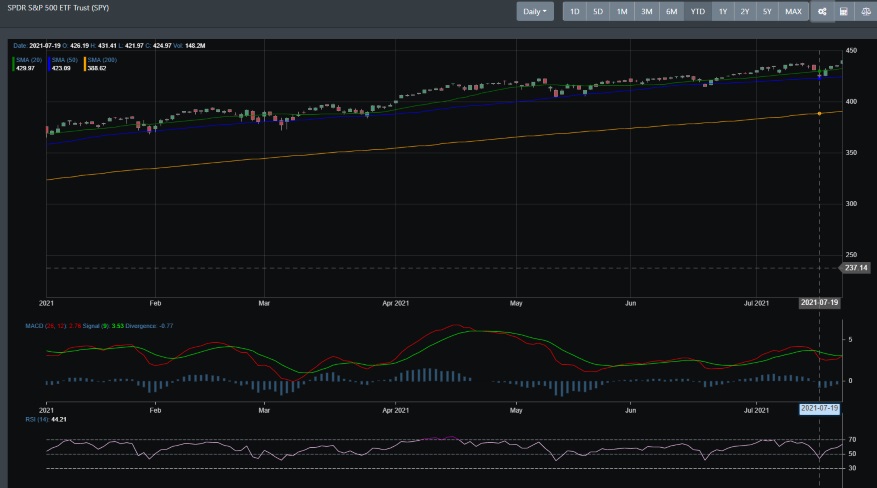
Big Picture
Please take a look at the S&P 500 image below. Looking at the daily price action below, it is clear as day that we are in a bull rally. This year alone, we had 7 market dips. Each dip was accompanied by a FOMO crowd that right now is guiding the market. As we discussed earlier this year, the past 10 market dips have been shallow and narrow. On Monday 7/19/2021, the S&P 500 dropped over 68 points, the 10-year Treasury fell to 1.18%, oil dropped below $70 and gold held support. If you were ready to sell out, then you would have missed the next day's action. That following Tuesday, the S&P 500 gained 64 points to set up a turnaround week for all major indexes. Friday's closing wrapped up with the S&P 500, Nasdaq Composite, and Dow 30 all at record highs. So much for the COVID delta variant correction that many called on Monday.
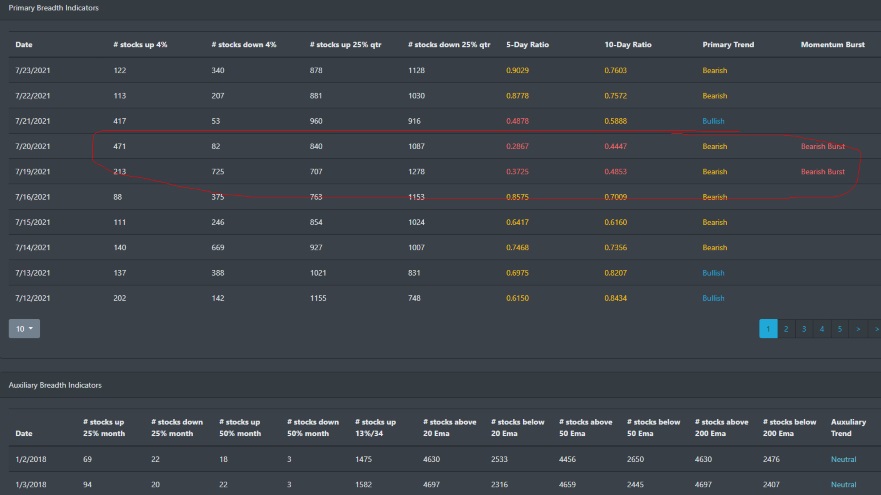
Market Breadth Table
Market breadth saw a bearish signal triggered on Monday 719 as markets reached an overbought condition. This is not a dire signal that should tell you to sell all your stocks but only an early warning indicator that markets are near an overextended state. It is a guide to be on the alert for the next few days or weeks and monitor the price action movement in the market. Well. the next few days gave a pretty clear picture that the market is still in the rally as the 5-day to 10-day ratio crosses over to the bullish side.
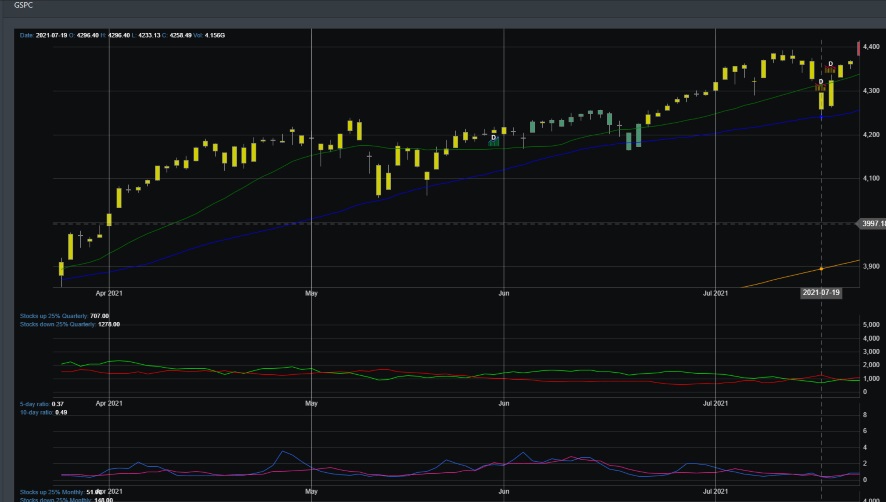
Market Breadth Chart
Market breadth is indicating a volatile summer with both the stocks up 25% versus down quarterly have crossed over and inverted in the past few months.
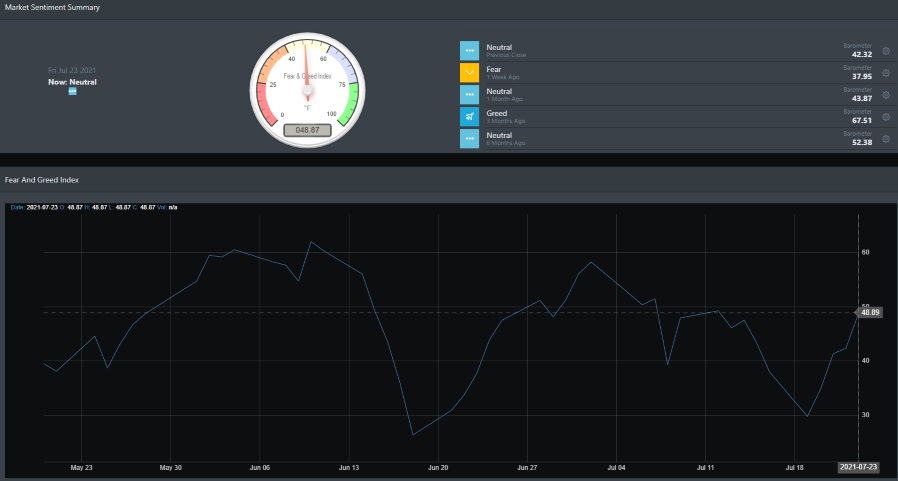
Market Sentiment
Market sentiment was in fear mode right on Monday 7/19 but it is interesting how sentiment can change literally overnight. Sentiment dropped to a low of 29.79 but quickly turnaround and is now trending higher toward a Greed reading. It should be a note to investors that sentiment can change quickly in today's market. There is a lot of noise within the near-term readings. While it is important to view market dynamics within the confines of the daily price action, one should keep it all in perspective of the overall big picture trend.
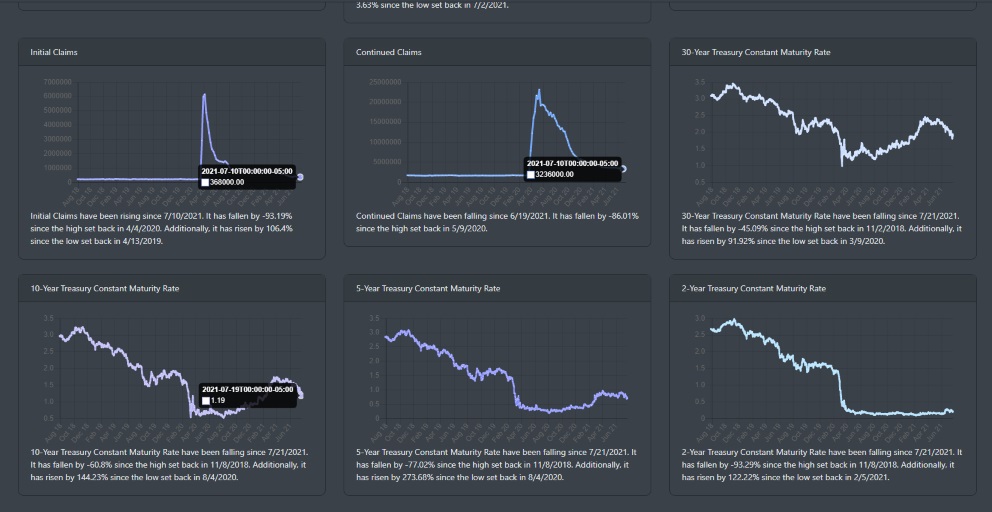
Economic Outlook
Most of the economic data is green and we have discussed many of those readings in our prior blogs. A soar eye for the current economic data is the labor market. Initial claims rose this week and are the highest since the May readings. Continued claims still remain elevated but are trending lower. If the labor market can strengthen, it will help allow the Feds to increase rates to adjust for the increase in inflation.
Market Outlook
Markets had a scare on Monday with technicals in the overbought region. Dip buyers came into full force and helped push most major indexes into new highs on the close of Friday.
SPY
SPY dipped down into its 50 DMA support and on Friday broke through resistance to make a new high.
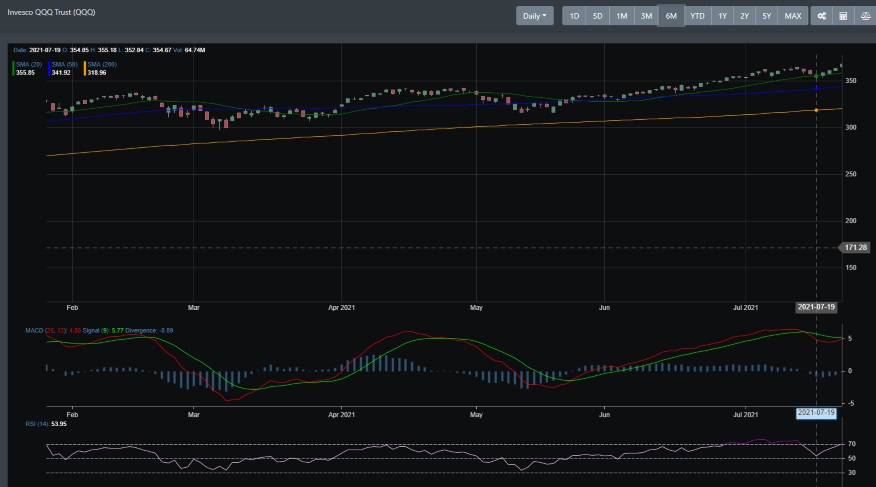
QQQ
QQQ hit its 20 DMA support line on Monday and soared to new highs on Friday.
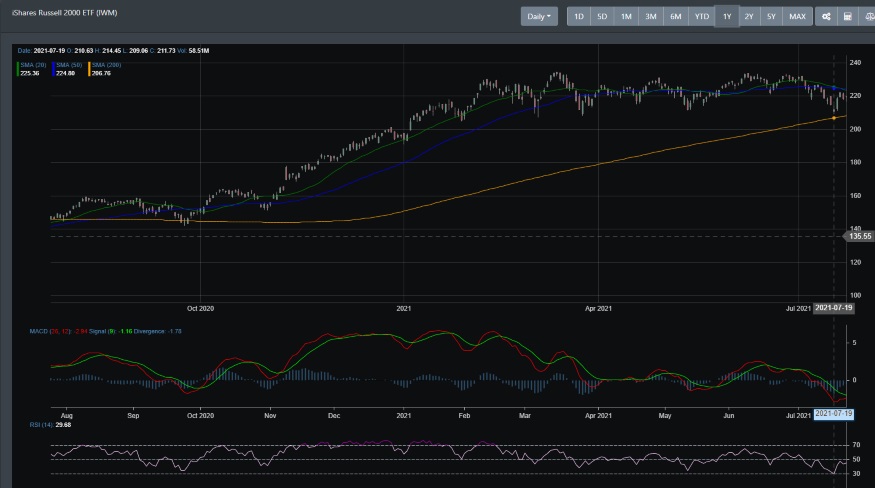
IWM
IWM is in a bearish trend and did almost touch its 200 DMA before pushing higher. On Friday, IWM erased all its loses but is still in a sideways consolidation pattern.
Concluding
Last December 2020, we stated that we expected the S&P 500 to hit the 4400 marker by end of 2021. Well, this week the S&P 500 broke through resistance and is right above that mark. Monday's drop worked off some of the overbought technical readings but right now the market is right back at overbought territory. This coming week will be telling if markets can hold the 4400 region. If so, we expect a potential drop in the market to alleviate the overextended conditions before rallying into the end of the year.