


Powerful and Accurate Market Timer
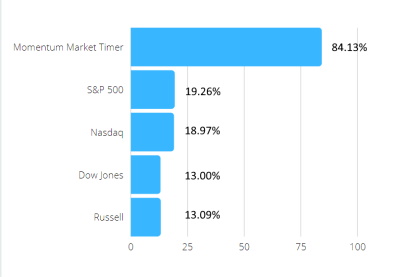
Today, we take a look at BullGap's Momentum Market Timer (MMT) and compare its performance with the major U.S indexes. From January 1, 2021, to August 17, 2021, the MMT has beaten the market hands down! If you were trading with the MMT system, your portfolio would have increased by +84%.
The below image shows the YTD performances for the major U.S Indexes. The S&P 500 and Nasdaq are +18% on the year. And what an incredible year it has been for the bulls as all indexes have beaten the average stock market return by +3%. According to Goldman Sachs, the S&P 500 on average returns 13.6 annually.
Indicator of Bullish and Bearish market direction
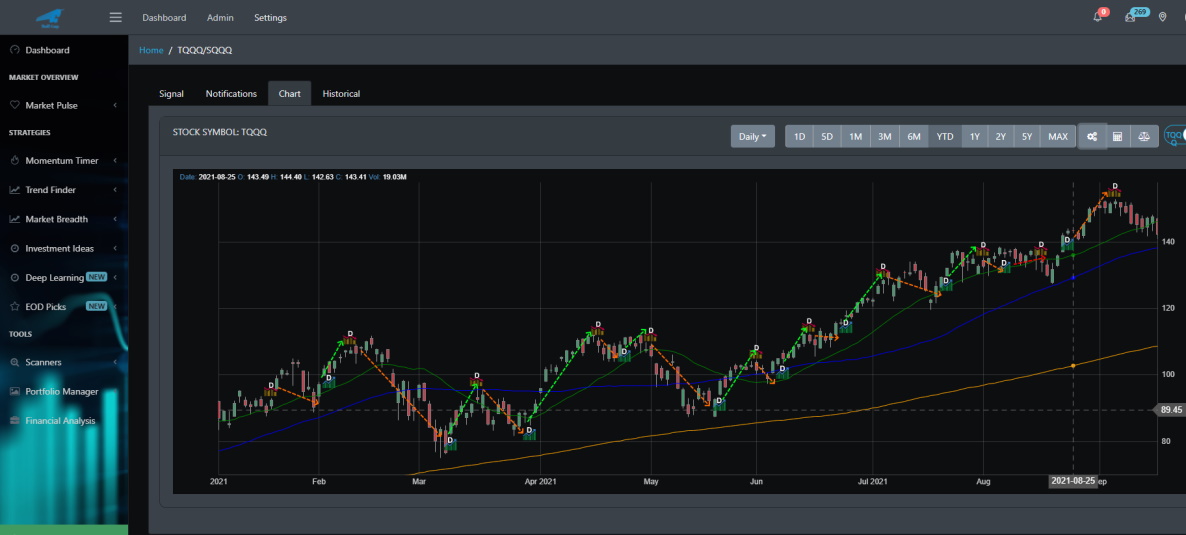
This year alone, BullGap's MMT has soundly beaten all U.S indexes by a milestone. Not only can the MMT be used to make profitable trades but it also can be used to determine when the market is in a bullish or bearish outlook. Below are the trade signals from the MMT. Notice that each buy signal (green D for daily buy) correctly identifies when the market will produce a bullish rally. And vice-versa each sell signal (red D for daily sell) identifies when the market will turn bearish.
Identified the last correction on 9/7/2021
If you look at the chart above, you will see that the MMT identified on 9/7/2021 that a market dip or correction was in play. After that sell signal, the S&P 500 and major indexes took a dip. Also, on February 2, 2021, it also signals a sell for which the market dipped to test its 50DMA. And yet again, it signals another one on May 3, 2021, for which the market dip to test its 50 DMA.
Below are all the trades made with BullGap's Momentum Market Timer for 2021. As of 9/17/2021, there are currently 20 trades (10 buys and 10 sell signals). From those trades, only one was a losing trade. If you were to invest $10,000 USD at the start of the year, your portfolio will now be standing at $63,001.48.
Learn more about BullGap's Momentum Market Timer
2019 Momentum Market Timer Portfolio
1/9/2020 - 9/7/2021 Starting Balance: $10,000.00 USD
| Transaction Date | Symbol | Action | Price | Num Stocks | Profit | Balance |
|---|---|---|---|---|---|---|
| 1/9/2020 | TQQQ | Buy | 47.17 | 212 | 1.02 | |
| 1/23/2020 | TQQQ | Sell | 50.73 | $755.78 USD | 10755.78 | |
| 2/4/2020 | TQQQ | Buy | 52.31 | 205 | 31.20 | |
| 2/13/2020 | TQQQ | Sell | 56.88 | $936.85 USD | 11692.63 | |
| 3/24/2020 | TQQQ | Buy | 21.78 | 536 | 18.55 | |
| 4/13/2020 | TQQQ | Sell | 28.29 | $3,486.68 USD | 15179.31 | |
| 4/22/2020 | TQQQ | Buy | 31.25 | 485 | 20.63 | |
| 5/13/2020 | TQQQ | Sell | 34.68 | $1,661.13 USD | 16840.43 | |
| 5/18/2020 | TQQQ | Buy | 38.56 | 436 | 30.45 | |
| 6/10/2020 | TQQQ | Sell | 48.67 | $4,407.96 USD | 21248.39 | |
| 6/19/2020 | TQQQ | Buy | 46.96 | 452 | 22.48 | |
| 7/9/2020 | TQQQ | Sell | 57.85 | $4,922.28 USD | 26170.67 | |
| 8/3/2020 | TQQQ | Buy | 61.92 | 422 | 42.54 | |
| 9/3/2020 | TQQQ | Sell | 73.86 | $5,042.90 USD | 31213.57 | |
| 9/25/2020 | TQQQ | Buy | 61.23 | 509 | 47.50 | |
| 10/6/2020 | TQQQ | Sell | 63.24 | $1,023.09 USD | 32236.66 | |
| 11/3/2020 | TQQQ | Buy | 61.70 | 522 | 29.26 | |
| 11/10/2020 | TQQQ | Sell | 67.25 | $2,894.49 USD | 35131.16 | |
| 11/27/2020 | TQQQ | Buy | 78.61 | 446 | 73.32 | |
| 12/10/2020 | TQQQ | Sell | 81.22 | $1,166.29 USD | 36297.44 | |
| 12/16/2020 | TQQQ | Buy | 86.36 | 420 | 28.34 | |
| 12/21/2020 | TQQQ | Sell | 86.84 | $203.70 USD | 36501.14 | |
| 12/31/2020 | TQQQ | Buy | 90.90 | 401 | 50.24 | |
| 1/19/2021 | TQQQ | Sell | 92.53 | $653.63 USD | 37154.77 | |
| 2/3/2021 | TQQQ | Buy | 100.65 | 369 | 14.92 | |
| 2/9/2021 | TQQQ | Sell | 107.31 | $2,457.54 USD | 39612.31 | |
| 3/9/2021 | TQQQ | Buy | 85.62 | 462 | 55.87 | |
| 3/16/2021 | TQQQ | Sell | 92.85 | $3,340.26 USD | 42952.57 | |
| 3/30/2021 | TQQQ | Buy | 87.34 | 491 | 68.63 | |
| 4/19/2021 | TQQQ | Sell | 108.76 | $10,517.22 USD | 53469.79 | |
| 4/26/2021 | TQQQ | Buy | 111.22 | 480 | 84.19 | |
| 5/3/2021 | TQQQ | Sell | 105.90 | -$2,553.60 USD | 50916.19 | |
| 5/20/2021 | TQQQ | Buy | 98.07 | 519 | 17.86 | |
| 6/1/2021 | TQQQ | Sell | 101.59 | $1,826.88 USD | 52743.07 | |
| 6/8/2021 | TQQQ | Buy | 105.02 | 502 | 23.03 | |
| 6/15/2021 | TQQQ | Sell | 110.20 | $2,600.36 USD | 55343.43 | |
| 6/24/2021 | TQQQ | Buy | 117.88 | 469 | 57.71 | |
| 7/6/2021 | TQQQ | Sell | 128.42 | $4,943.26 USD | 60286.69 | |
| 7/22/2021 | TQQQ | Buy | 132.17 | 456 | 17.17 | |
| 8/2/2021 | TQQQ | Sell | 132.70 | $241.68 USD | 60528.37 | |
| 8/6/2021 | TQQQ | Buy | 136.43 | 443 | 89.88 | |
| 8/17/2021 | TQQQ | Sell | 133.77 | -$1,178.38 USD | 59349.99 | |
| 8/24/2021 | TQQQ | Buy | 143.25 | 414 | 44.49 | |
| 9/7/2021 | TQQQ | Sell | 152.07 | $3,651.48 USD | 63001.48 |