


Though not a substantial rally, the Santa Claus rally did produce this year. With the last five trading days for 2022 and the first five for 2023, the S&P 500 rose above 2022's close at ~3839. That is remarkable considering the current pessimism in the market and the many financial pundits calling for the market to drop down to the 3300 price region. This falls in line with what we discussed in our last blog, where we concluded with the following:
"That said, markets are on support near the 3700 to 3800 region. The bulls can swing back up if the current pullback can hold this region. On the other hand, any breakdown of that support can mean more selling pressure for the markets. Though the technical setup shows bearishness, gauging how our sentiment data has behaved for the past quarter suggests that this current pullback should stabilize around the support area mentioned above."
The S&P 500 has held onto support and is slowly inching higher. The DJIA has been on a tear, and the golden cross was triggered in mid-December. Several dow stocks such as Boeing (BA) and Raytheon (RTX) have been a strong rally. Growth stocks have been hammered for much of 2022 but have a look of a near-term leveling is setting in. With all the fear of a brutal recession and inflation numbers, it was interesting to see markets on Friday rally even when the U.S Bureau Of Labor Statistics posted that the job reports showed that 223K jobs were created in December 2022. In addition, the unemployment rate fell to 3.5%. The exciting part is that a favorable labor market suggests that the Feds will continue their hard stance on raising rates, thus pulling the financial markets lower.
Big Picture
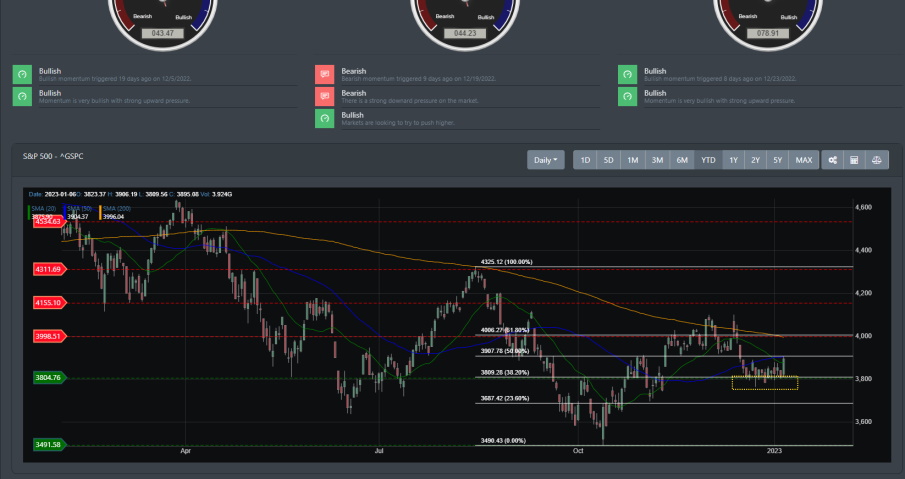
Since the pullback that started in early December, all major indices have been at or near their support region. As noted in the yellow box below, the S&P 500 has been hovering above its support region at 3800. However, as of late, the S&P 500 has been slowly grinding higher. Immediate resistance can be found at 3930 region. And 4000 is the strong resistance area for which the price could not hold back in early and mid-December. While many market analysts will view the current landscape as a rally due to faltering to the 3300 region, we see this as a consolidation period for the markets. Markets have rallied off their October lows to break through several key resistance lines. As a result, markets look like they want to move higher.
Market Breadth
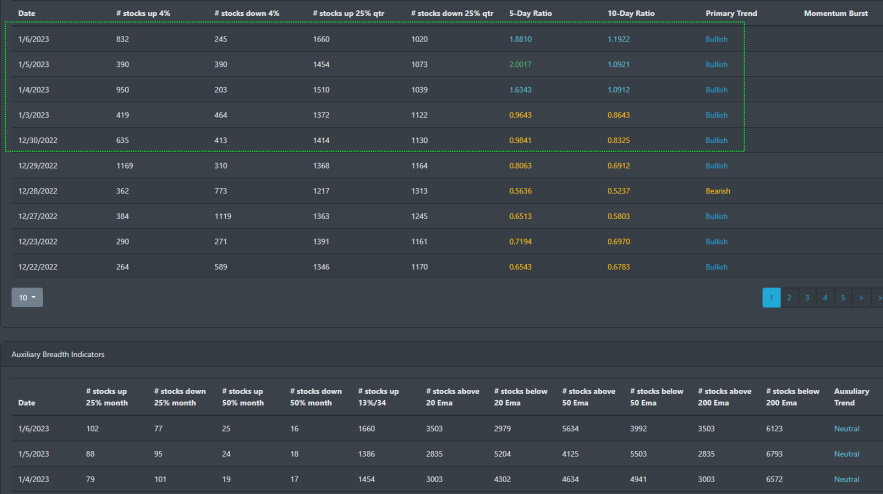
After some bearish readings in mid to late December, internal market readings are bullish. The green box below shows the data points where internal data shows bullish readings in the near term.
Market Sentiment
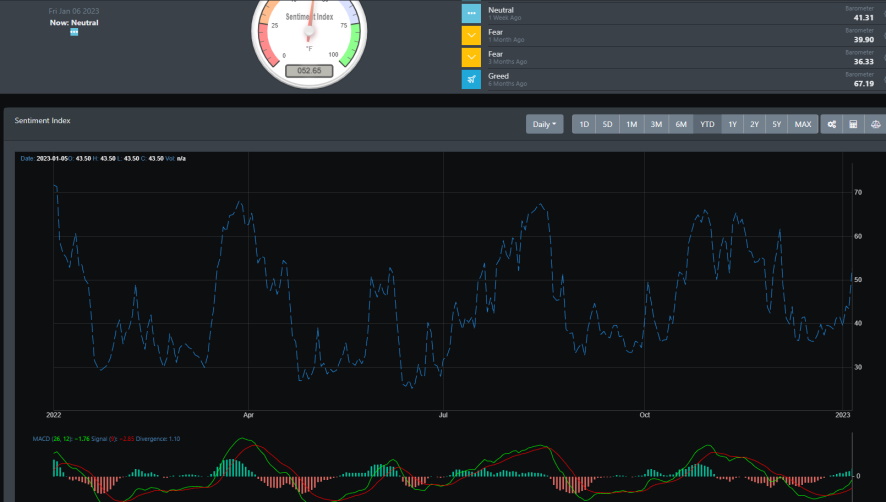
Market sentiment has been neutral for most of December. But just like the market breadth readings, it has slowly moved higher near the close of 2022. This only says a little other than investors are still wary about the recession forecast and the Fed's continued response to combating inflation.
Market Outlook
Markets are technical in oversold territory. After having consolidated for most of December 2022, markets have a look of wanting to move higher. With a positive week to start 2023 and markets not dropping as predicted by market pundits, strong data points suggest markets are poised for another push higher.
SPY
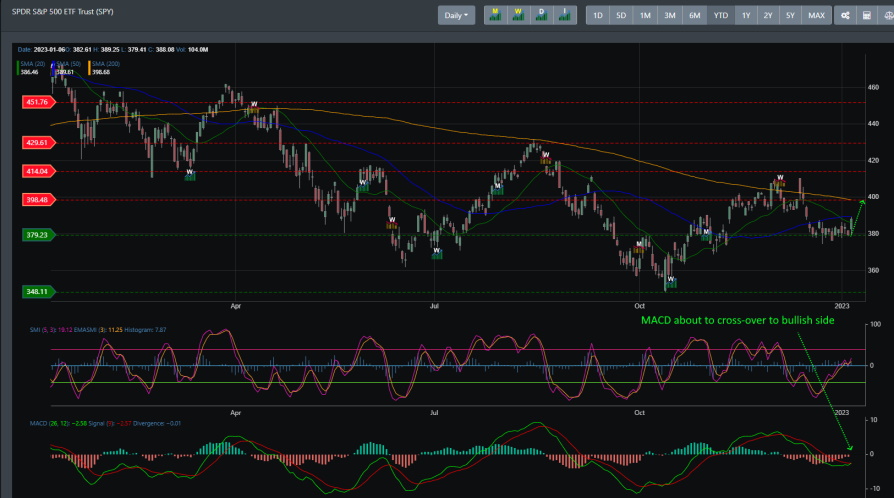
SPY has rallied off its October 2022 lows to fall and consolidate near the 380 support region. The weekly snapshot still shows downward pressure on SPY, but the daily MACD is now poised to cross over to the bullish side.
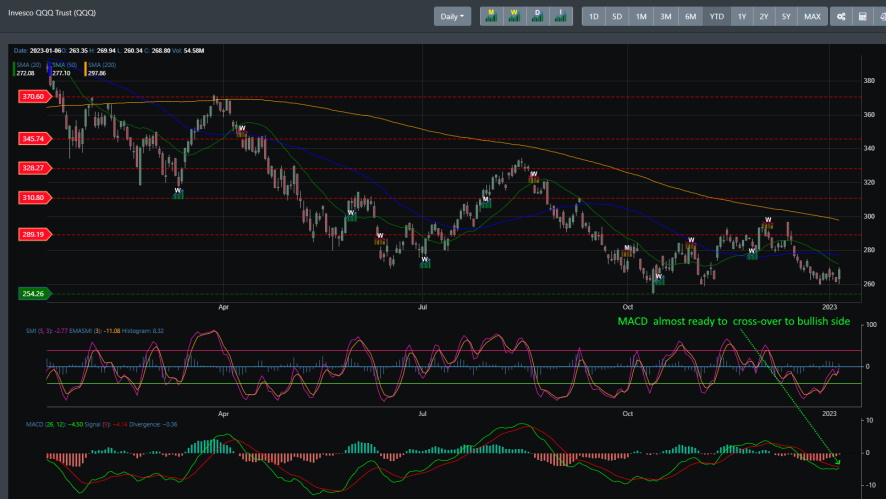
QQQ
QQQ has been struggling to break out over its 289 resistance region. Since December, it has been moving lower, with recent prices showing a bottoming is forming. Support now is at the 254 region. Though the weekly technical indicators still show bearish readings, the daily readings are in oversold territory, with the MACD ready to turn bullish.
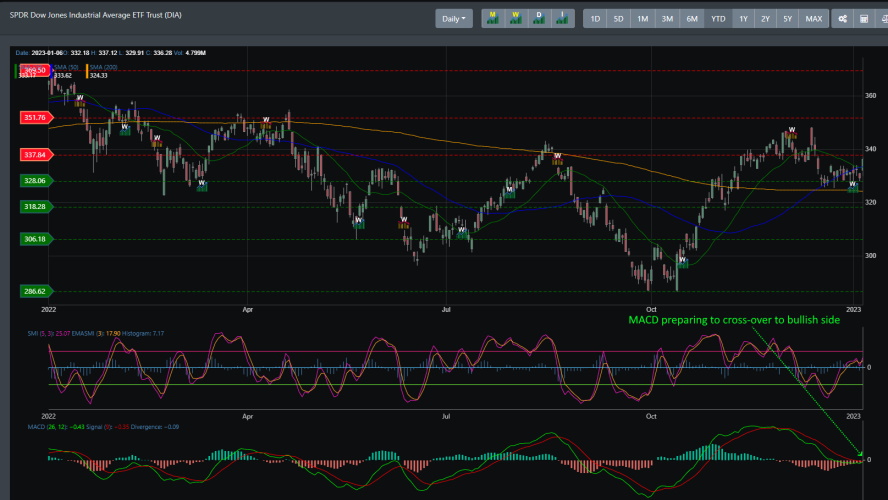
DIA
DIA has had a breakout since its October 2022 lows, unlike the other indices. Like all the other indices, however, it also has some bearish readings on its weekly timeframe. However, the golden cross for DIA broke out in mid-December, and the daily MACD is about to turn positive.
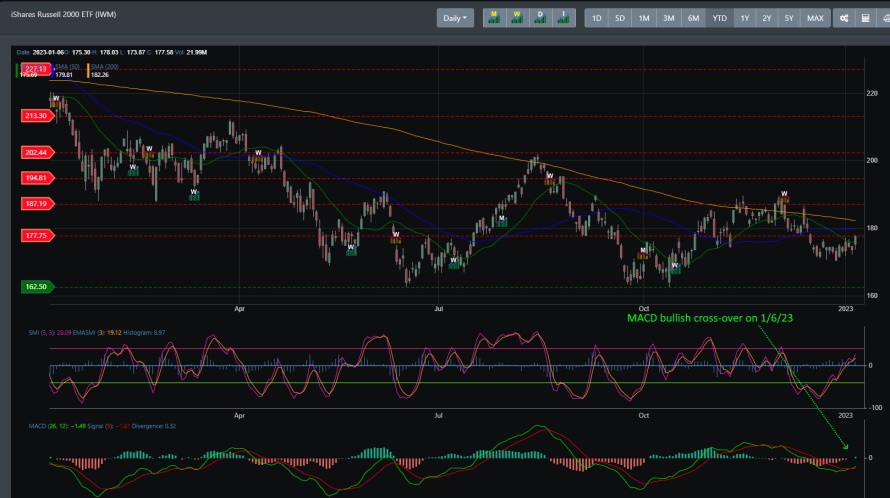
IWM
IWM also had a strong rally since hitting its low back in October 2022. Since December, IWM has had trouble breaking through to its resistance at the 187 region. Unlike the other indexes, the daily MACD has already turned positive.
Concluding
The key is still resistance sitting at the 3800 region. This is critical as a drop below this can take the market down toward the 3490 support region. There is potential for a near-term rally as all major indices are technically setup for a push higher. That said, the weekly timeframe still has downward pressure on the market, and this could limit the near-term upside. If markets can hold, there is potential for markets to challenge their next resistance line. And that is near the 4000 to 4100 resistance area.