


Markets rallied to all-time highs this week on the backdrop of long-term interest rates retreating. This despite the fact that the inflation data this week showing the highest annual increase for consumer prices in a decade. So, why the contrast in the news? It was just a couple of months ago that many market experts were calling for a sharp correction due to the worries of increasing inflation. During that time, BullGap viewed the recent market action as more of a result of the incredible 2020 rally that has markets in a consolidation phase. And just recently in the past few blogs, we have mentioned that we expected the markets to power ahead into all new highs.
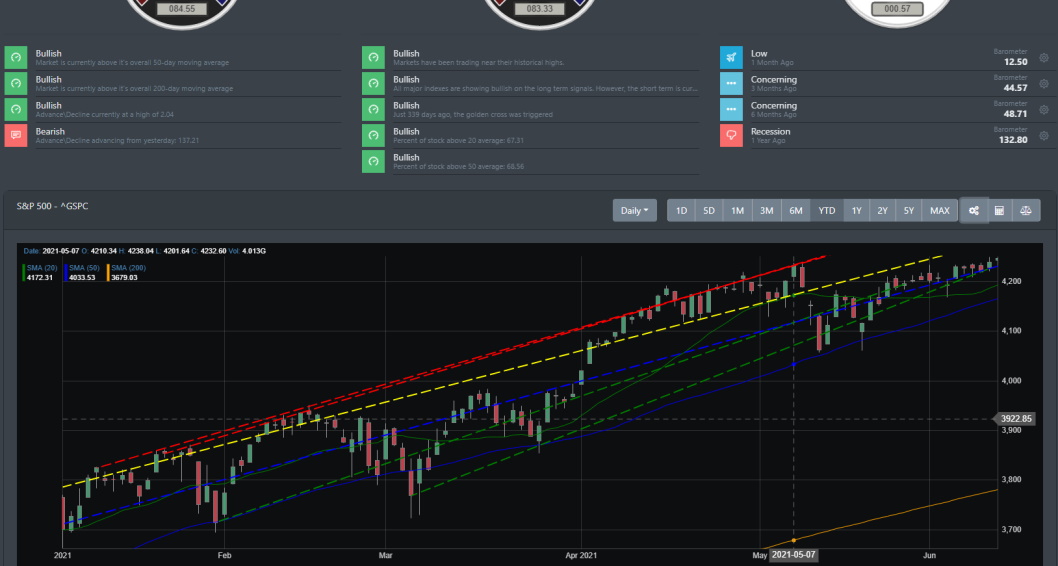
And rising for the 3rd straight week, the S&P 500 closed this week hitting a high on close at 4247.49. SPY finished the week with +13% YTD.
As for the Treasury yield, it did rise to a peak of 1.75% back in March of this year. It has since then trended down where now we find the 10-year Treasury trading around 1.45%. It seems that the bonds market may have already priced in the current inflation data and is in agreeance with the Feds that all this inflation pressure is transitory.
Big Picture
From our couple of blogs, we were mentioning that market breadth was gaining strength and there was a strong bullish signal in our Market breadth indicators. A majority of the market sectors were showing increase bullishness. The Energy sector with crude oil has been a strong performer with crude oil hitting its 52-week high. Other sectors are up by 20%. All of this gain has been in the time that many market pundits were calling for a topping and imminent correction.
And for the S&P 500, it is up now more than 13% on the year. Grinding higher even with the CPI report coming out this week showing more inflation pressure backdrop. As we discussed in our prior blogs, BullGap looks at the market data and not the news. Trying to guestimate the market based on news headlines will leave many frustrated and just waiting for the next "big event" scenario.
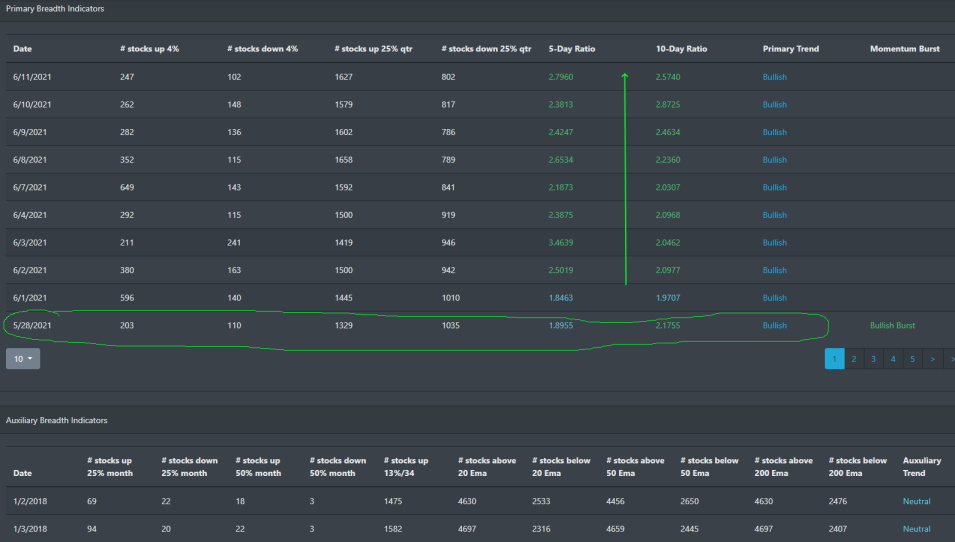
Market Breadth Table
Market breadth as we mentioned at the start of June was turning bullish. With our most recent bullish burst signal being triggered on May 28, 2021. Market breadth is strong across most sectors and the percentage of stocks above their 50 and 20 EMA is increasing.
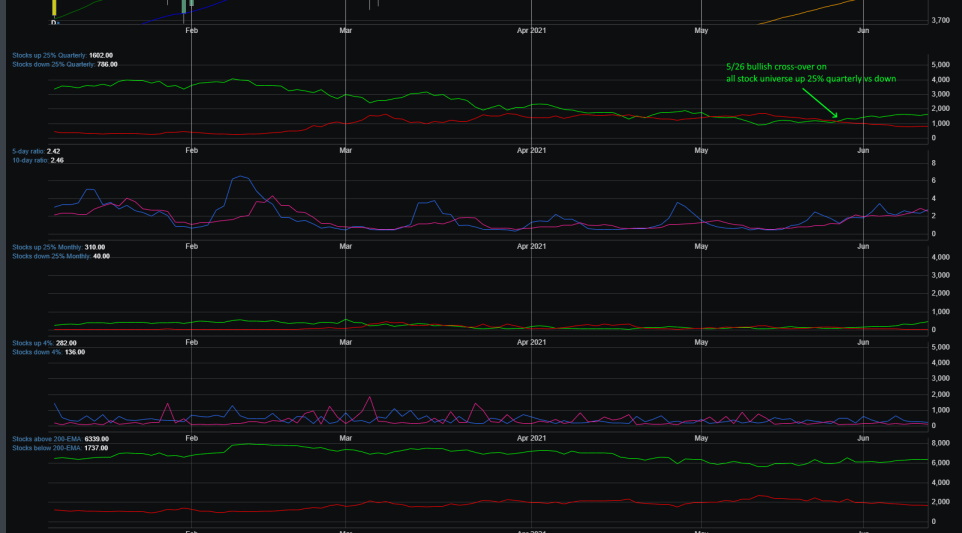
Market Breadth Chart
At the tail end of May, you can see that the cross-over occurred on stocks up 25% versus stocks down 25% into bullish territory. Since March it has been trending down as markets consolidated from the 2020 Rally.
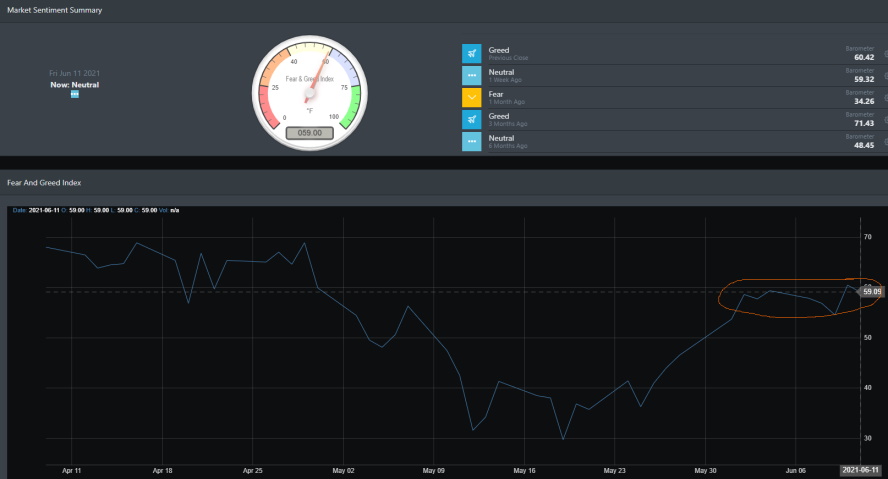
Market Sentiment
Bullish sentiment has been rising since late May. BullGap's market sentiment index reached the Greed level last week at 60.42 and just recently had a minor pullback this week. Just a few perecentage off of last week's Greed level. From a contrarian perspective, this reading has a "calmer" look than the recent highs of April.
Economic Outlook
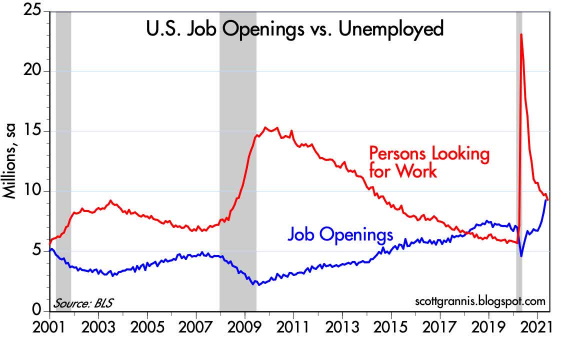
The current narrative recently from the economic side has been of the labor market. A recent report from the JOLT job numbers shows a large number of individuals quitting their job versus the number of job openings available (9.28 million job openings). Both of these reach historical highs recently. If you look at the chart below, it shows an interesting development in the labor market. The number of job openings is historically high while there still is a large (millions) of workers just sitting on the sidelines. It seems employers are unable to find qualified or individuals wanting to work (even with incentives). One explanation for this could be the unemployment benefits that have created incentives for many to remained unemployed until the benefits expire in September.
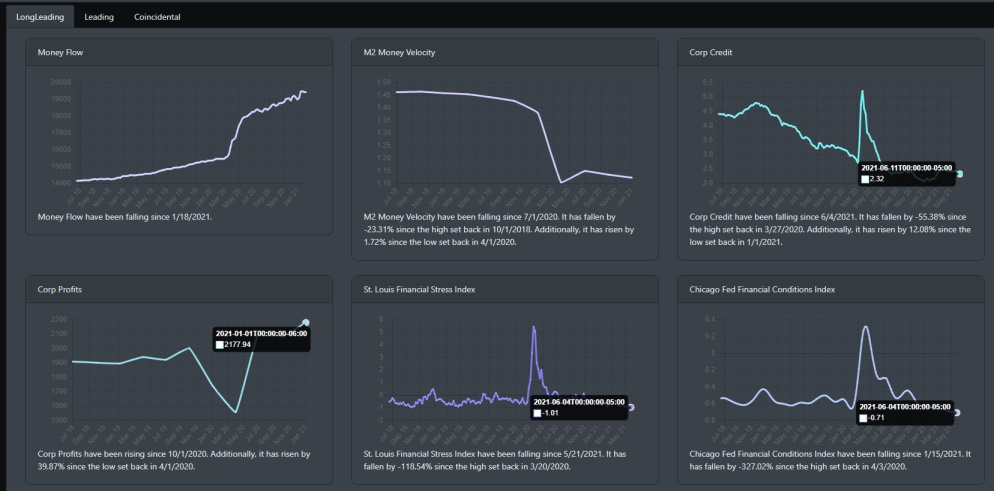
Below are some of the long leading indicators. By looking at the Money Flow index, there is ample liquidity in the market. Corporate credit is historically low suggesting the market is looking at an economic boom and expanding corporate profits. The St Louis Financial Stress Index and Chicago Fex Index are at all-time lows suggesting no strains or hindrance in the current economic reopening.
Market Outlook
From a technical perspective, market valuations are very high. Even with the economic expansion that is just starting, this can have an impact on the immediate upside for the market. We can see that with SPY's price action in February as it has started to consolidate before running up to new highs this week. Most indexes have been in consolidation lately and only recently have they been pushing higher again.
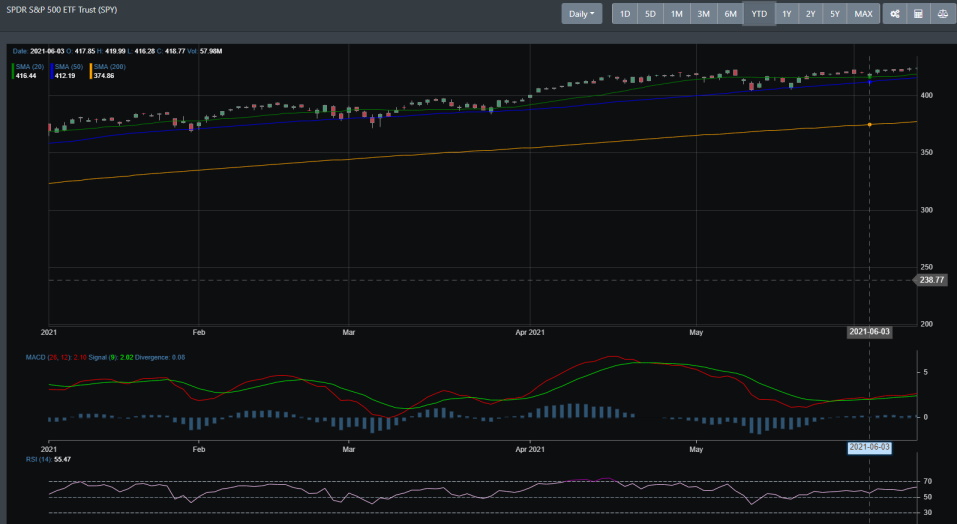
SPY
From the March 2020 lows, SPY has had a rallied of more than 140%. This bull market has been grinding higher for more than a decade. Price action is well above its 50 and 200 DMA. The daily technical readings are bullish.
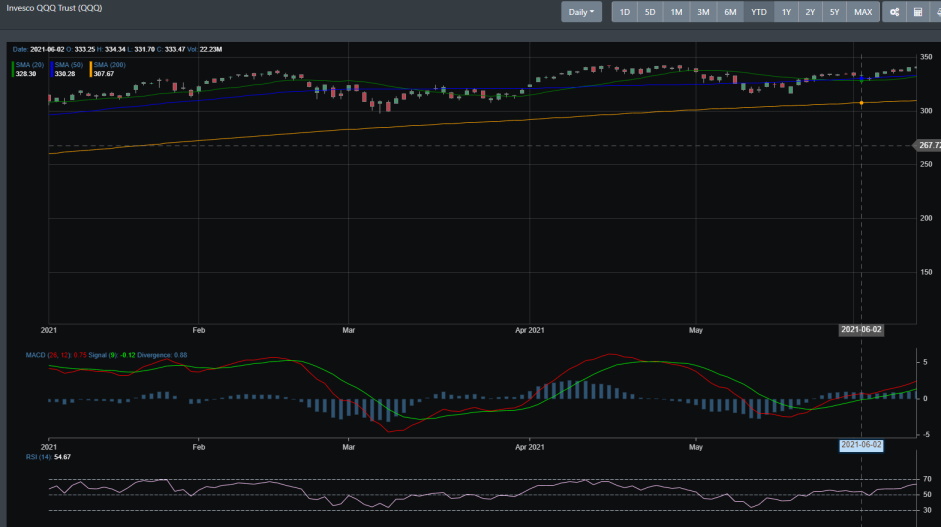
QQQ
QQQ is up more than 100% from its March 2020 lows and been consolidating for most of the year. Only until recently has it started to push higher. Like SPY, its overall trendline is bullish.
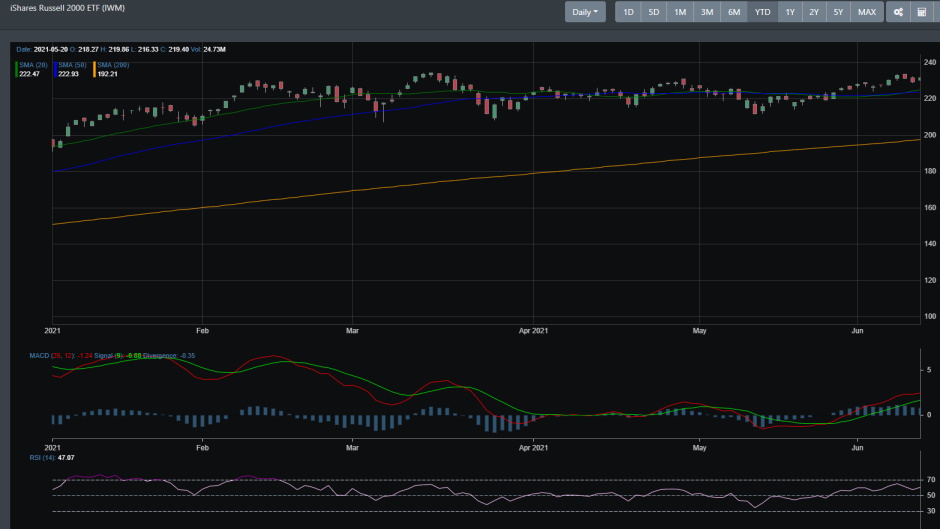
IWM
IWM was a strong performer in 2020. Coming off the March 2020 lows, IWM is +145%. It though has been consolidating since February and only until June has it pushed higher.
Concluding
The financial markets have certainly confused a lot of investors and experts with worries over market tops, imminent sharp correction, and runaway inflation. As we discussed many times in our prior blogs, we see the market in a consolidation phase. After running 100%+ from the March lows of 2020, markets are digesting the gains. It has only been until recently have markets started pushing higher. And as we discussed a few months ago, we see the S&P 500 hitting 4300 by sometime this Summer. The Nasdaq 100 and Russell 2000 also are moving into their all-time highs from early May.