


Since coming out of 2023, markets have been rallying higher into the new year with more than +4.0% gains for the S&P 500. And after hitting resistance near the 4000 region, markets are consolidating after a strong rally. As we made note from our last blog on 1/7/23, we stated the following:
"The key is still resistance sitting at the 3800 region. This is critical as a drop below this can take the market down toward the 3490 support region. There is potential for a near-term rally as all major indices are technically set up to push higher. That said, the weekly timeframe still has downward pressure on the market, and this could limit the near-term upside. If markets can hold, there is potential for markets to challenge their next resistance line. And that is near the 4000 to 4100 resistance area."
Coming out of the new year, the S&P 500 was hovering over resistance, with many market pundits screaming about recession and markets dropping lower. However, as we discussed in our last blog, with technical readings turning bullish and oversold conditions set, there would be a good chance that we see a short term rally. And the day after we posted this comment, markets rallied strongly and rallied to challenge resistance.
Earning season thus far has been mixed. With EPS beating estimates roughly 60% of the time and retail sales and manufacturing output showing weak performance, there is still much noise with the recession crowd and bears calling for the market to drop lower.
Big Picture
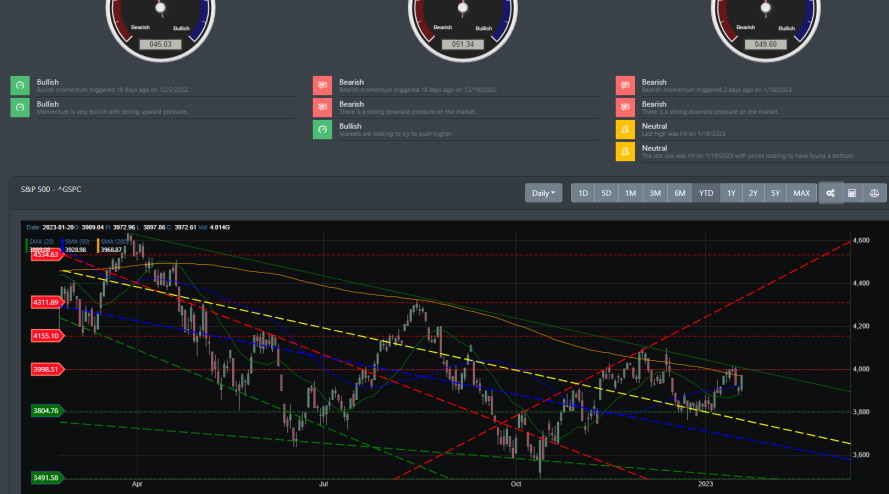
Last week the S&P 500 had the potential to have a break out with the golden cross-over. The 4000 resistance region has been a stickler point for the bulls since November, where four attempts to break out higher have failed. Support has held steady near the 3800 region and thus has allowed the prices to close in on the 200DMA. Please see the image below, where we use our automatic trendline generator with support and resistance to give a picture of the overall S&P direction. Prices are well above the average trendline (blue and yellow dash line). There is still strong resistance at the 4000 level, with the 3804 level acting as support.
Market Breadth
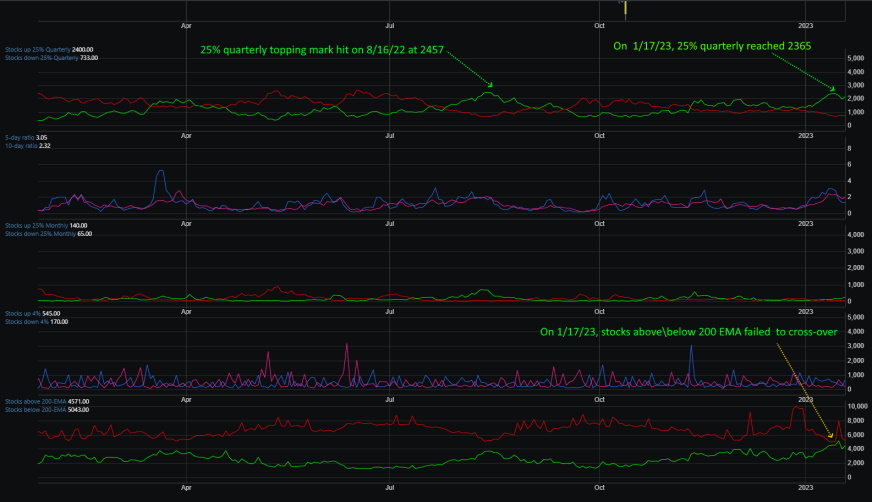
Market breadth internal readings have been improving since the bullish cross-over on the stocks up\down 25% back on 12/29/22. This week, stocks up 25% quarterly have hit a near high and are challenging the one set back on 8/16/22. The last time this reading reached this high was back in November 2020, when stocks were gearing for a strong rally. With the stocks above their 200-EMA looking to cross over potentially this week, there is a strong chance we are seeing a strong resurgence of market breadth.
Market Sentiment
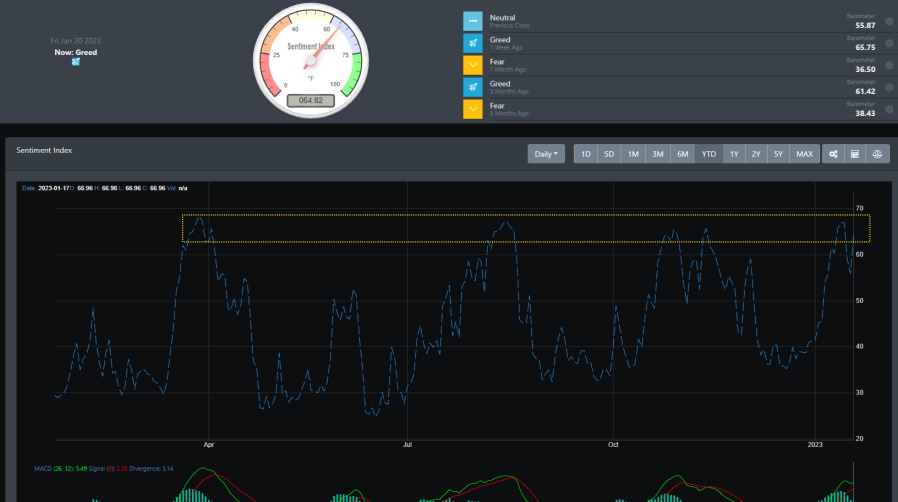
Market sentiment has kicked into greed mood and is hovering over the high end of the sentiment reading. When sentiment reached this level for the last nine months, markets took a nosedive. The image below shows this in April 2022, mid-July 2022, and mid-October 2022. However, the only difference between now and then was that internal breadth data was abysmal, and overall market technicals were bearish. As a result, the current landscape looks like there is more room to move higher, with sentiment slowly turning more bullish.
Market Outlook
Having gone through January 2022, what a year makes for the current trend in the market. Last year, markets had a topping and turned downward for most of 2022. However, with January almost in the books, U.S. stocks have been in a strong rally. After rallying for most of January, consolidation is the name of the game, and investors are taking profit after stocks push up to nearly +4.0% for the year. The current pullback has given back +2%, but markets are more poised to move higher than last year.
SPY
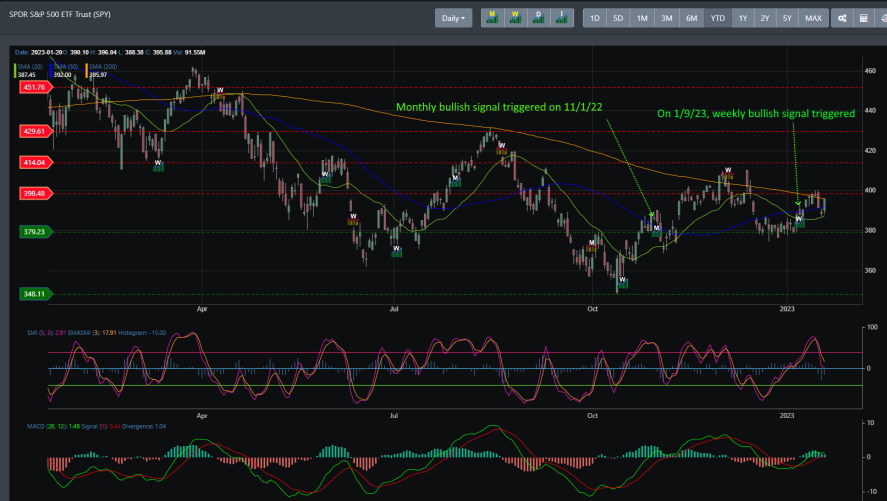
SPY is looking very bullish now. With both the monthly and weekly bullish signals being aligned, there is good reason to see SPY potentially challenge its golden cross over this week. The current pullback is forming a consolidation pattern. However, the intraday readings suggest more room to move higher in the coming week.
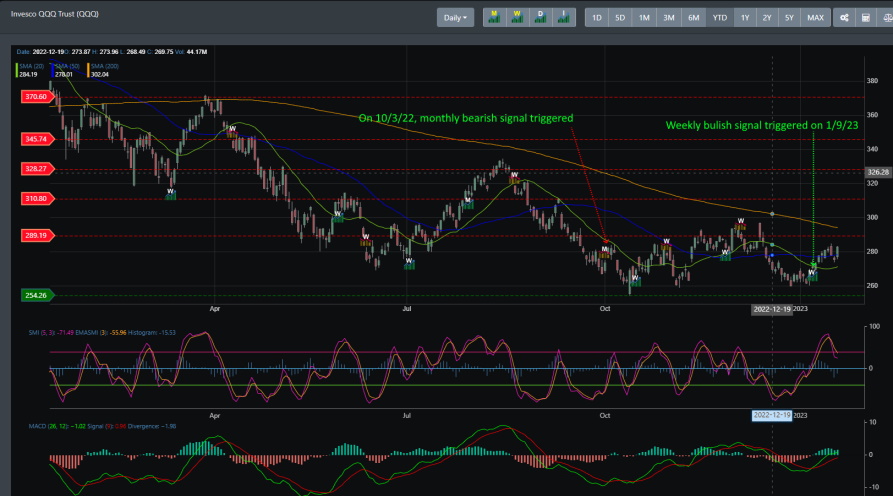
QQQ
Our last blog stated the following: "Since December, it has been moving lower, with recent prices showing a bottoming is forming. Support now is at the 254 region. Though the weekly technical indicators still show bearish readings, the daily readings are in oversold territory, with the MACD ready to turn bullish." And just like that, QQQ received a weekly bullish buy signal on 1/9/23, and QQQ has not looked back but is pushing higher. It expects to challenge its next resistance near the 289 region.
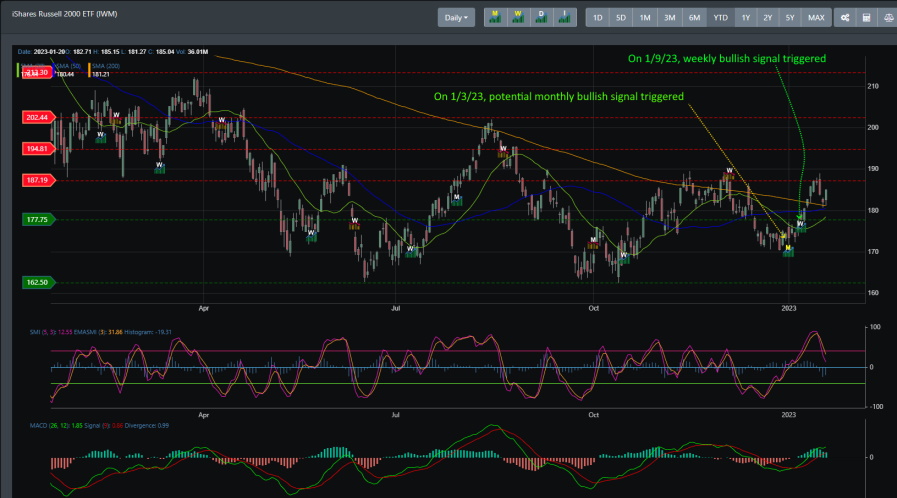
IWM
As we have mentioned many times in our blogs, IWM is one of the leading indicators for how U.S. markets will behave. And this week, a "potential" monthly bullish signal was triggered for the month of January. Additionally, a weekly bullish signal was also triggered on 1/9/23. With this alignment, we are looking at a high probability that the current pullback is gearing for a push higher.
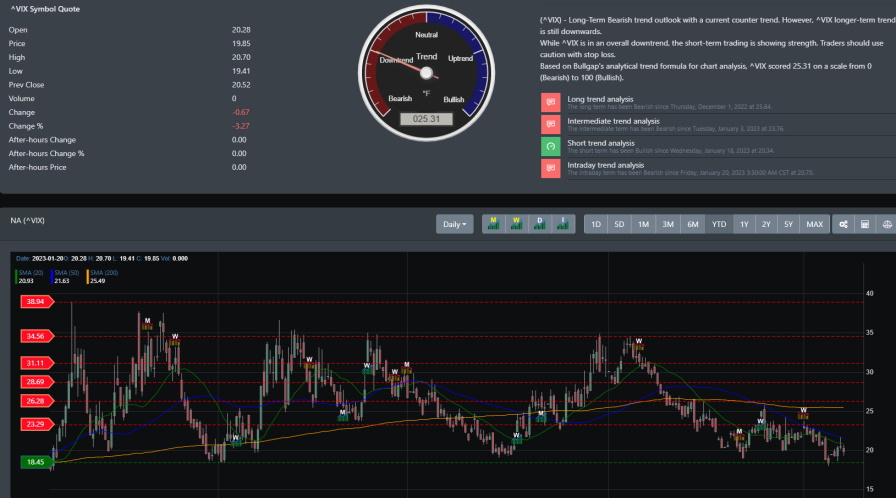
VIX
One interesting chart that we have seldom discussed is the Volatility Index (VIX). For the past year, you can take a survey of the VIX, and when the weekly buy signal triggered below, it was a strong indicator that started selling in the markets. Conversely, markets pushed higher when a weekly sell signal began on the VIX. Right now, the VIX is still within its weekly sell signal, and markets have rallied. Additionally, the VIX has not reached its all-time low, which also indicates there is a likelihood that markets still have room to move this week.
Concluding
With all the fear-mongering out in market, you were certain markets would have caved in by now. That is if you follow the advice of market pundits and recession stories. Fear of the Fed tightening the monetary policy, reasons for a global recession, and market pundits calling for the S&P 500 to drop to 3300 level.
The technical readings are in right now, and all signs point to markets gearing up for a push higher, with the S&P 500 ready to potentially hit its golden cross-over this week or next.