


Well, so much for sticking it to the man. Last week, we mentioned the high speculation trade on GameStop (GME) and how it would soon turn out badly. GameStop's stock price soared on the Reddit rebellion and soon found itself falling back down to earth this week. As for the rest of the market and discussed in our last blog where we said we expected a bounce back, the market sure did rally. The S&P 500 closed positive on every single day last week. Also, the earnings picture has been remarkedly positive. Over 200+ S&P 500 companies have reported their Q4 results with over 80% beating EPS estimates and 78% beating revenue estimates.
Big Picture
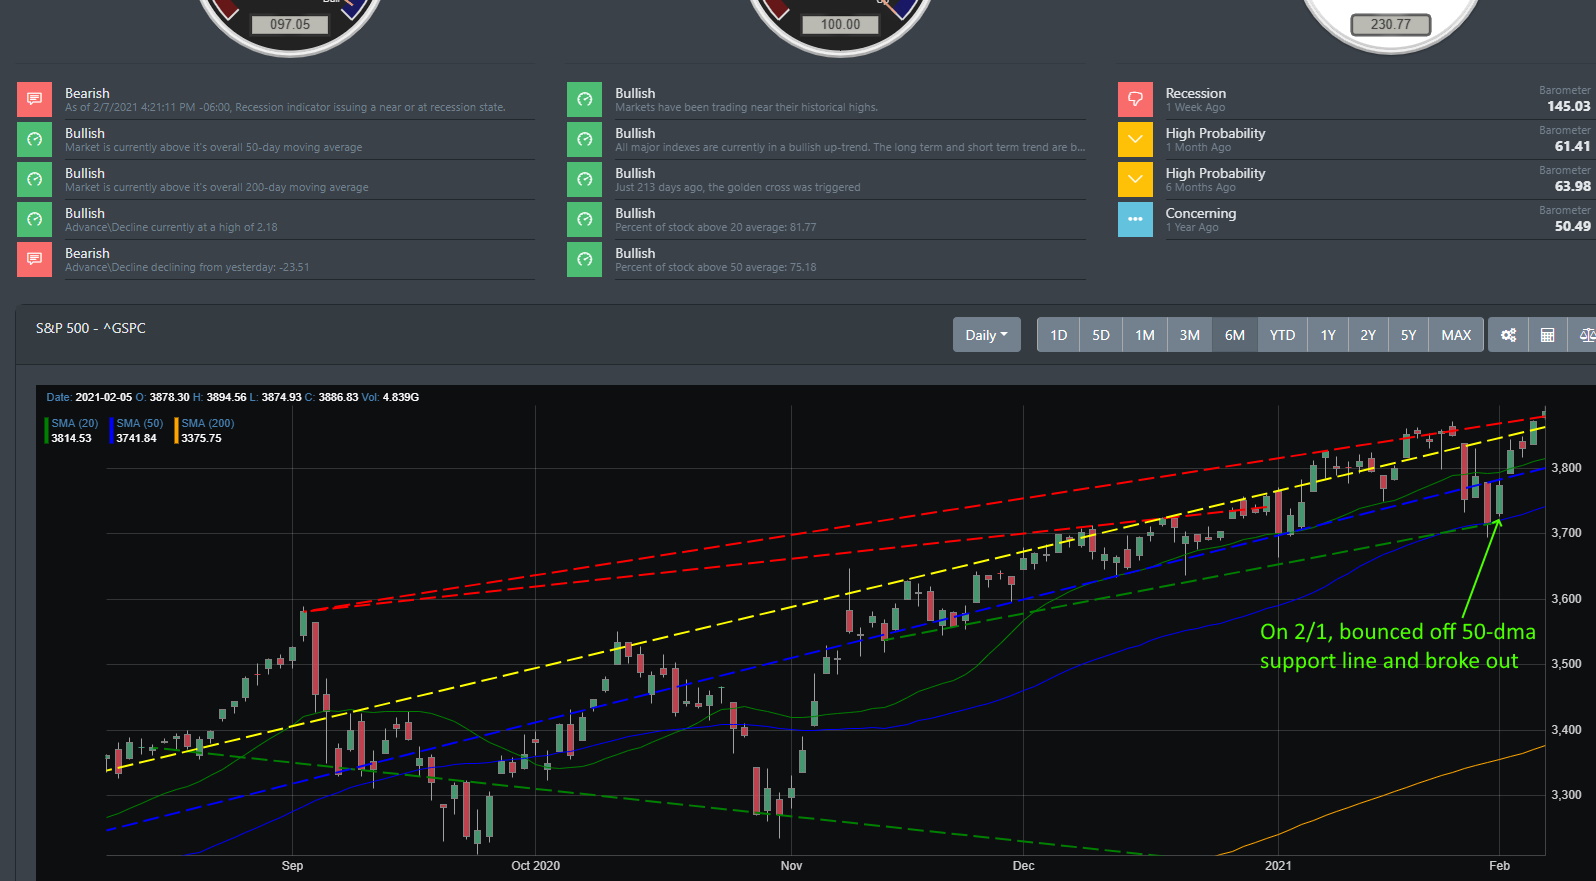
For the past few weeks, market pundits were crying out that the market was overdue for a substantial correction. As of now, the stock market did not follow the script as plan and posted a 3.6% pullback before rallying to new highs this week. The S&P 500 broke through the 20 DMA support and was looking at breaking through to the 50-day DMA. On Monday, that retest of the 50 DMA was the key turning signal that helps propel the markets upwards. In less than a span of seven trading sessions, the S&P 500 went from overbought to testing the 50-DMA and now right back to overbought conditions. It has now broken through into BullGap's main resistance trendline (red-dash).
Market Breadth
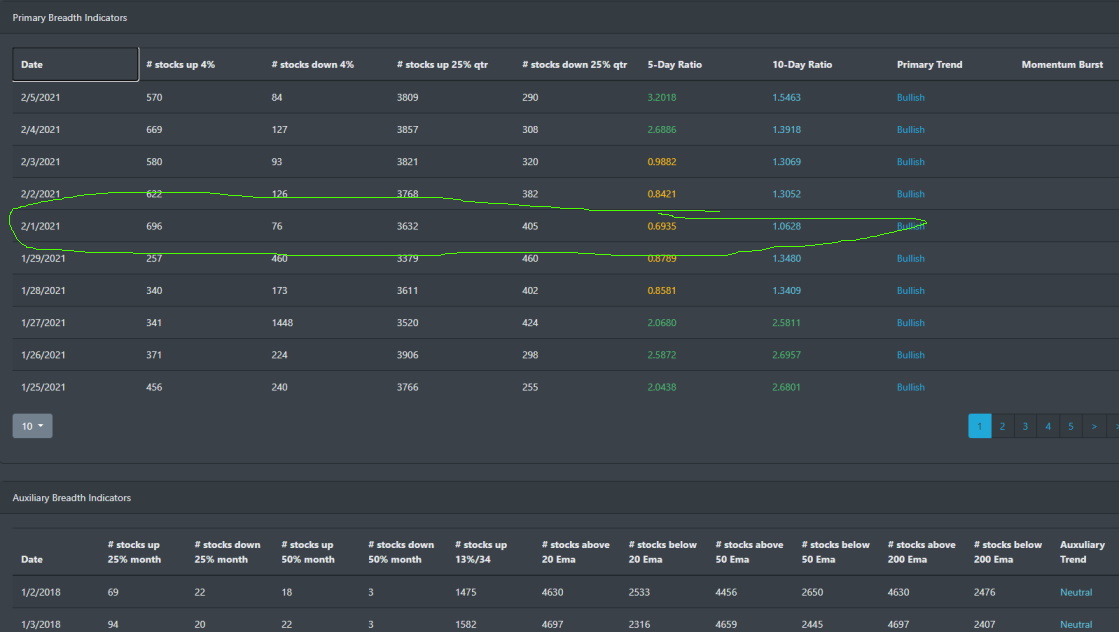
During the recent pullback, we saw the market breadth consolidating toward the 10-day Ratio of 1.0 averages. On 2/1, market breadth switch gears as major indices such as the S&P 500, Nasdaq, and Russell 200 posted new highs for the week. With over 75% of stocks trading above their 200 EMA, there is a strong indication that there is an across-the-board strong breadth throughout the market. All major market indexes are extremely bullish and the underlying individual stock charts are showing the same bullish structure.
Market Sentiment
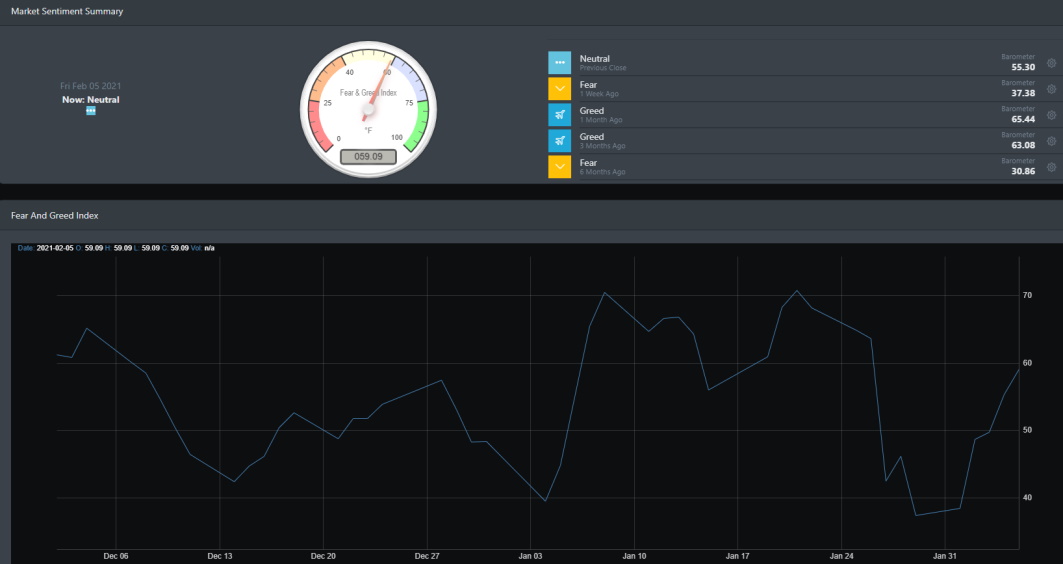
The market has become quite resilient as of late. Since March 2020, when the market bottomed out, every dip that occurred since has been bought right back up. Regardless of events that turned up during the 2020 period, the market just keeps pushing higher. Looking at our sentiment readings below, our fear reading bottom out on 1/29 at a reading of 37.38 and has since climbed to near Greed territory in a matter of 5 trading days. This sentiment acceleration toward bullishness occurred also on 1/4/2020. When this type of acceleration occurs, it typically represents a heavy bullish sentiment is coming over the market. Unless an unexpected event occurs that spokes the market, we expected this bullish trend to ride into next week.
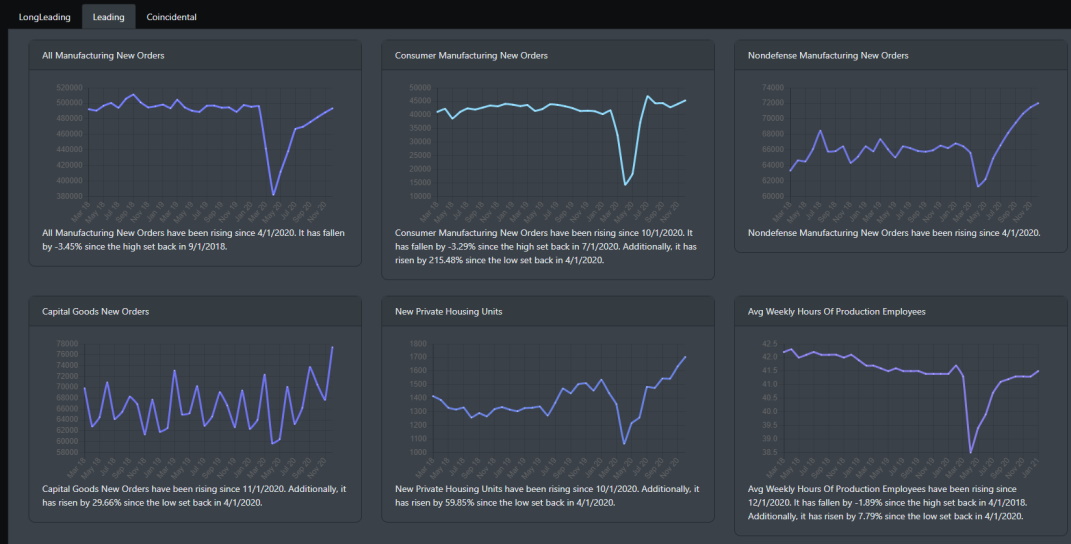
Economic Outlook
Liquidity is the name of the game for the U.S economy. Corporate credit is at all-time lows allowing businesses to borrow and grow.
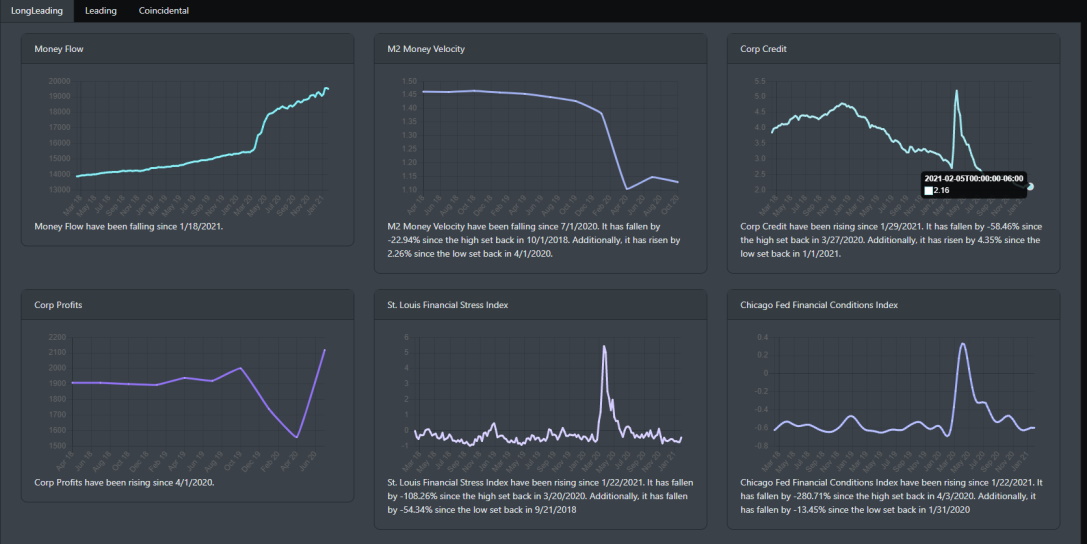
Most of the leading indicators are positive with a majority already in a V-shape recovery. The housing market is one of the clear winners here.
Market Outlook
Last week there was a look of a possible correction taking place in the market. Well, it is clear now who is in control of this market. The Bulls have been running the rally since the March 2020 lows and haven't looked back. Small-caps was the winner this week where it pushed +7%. Large caps also posted solid gains while the treasury market continues its slow decline.
If we take a step back and look at SPY, QQQ, and IWM on the weekly chart, it is clear the markets are in a major rally. All indices are well above their 20, 50, and 200-day moving averages.
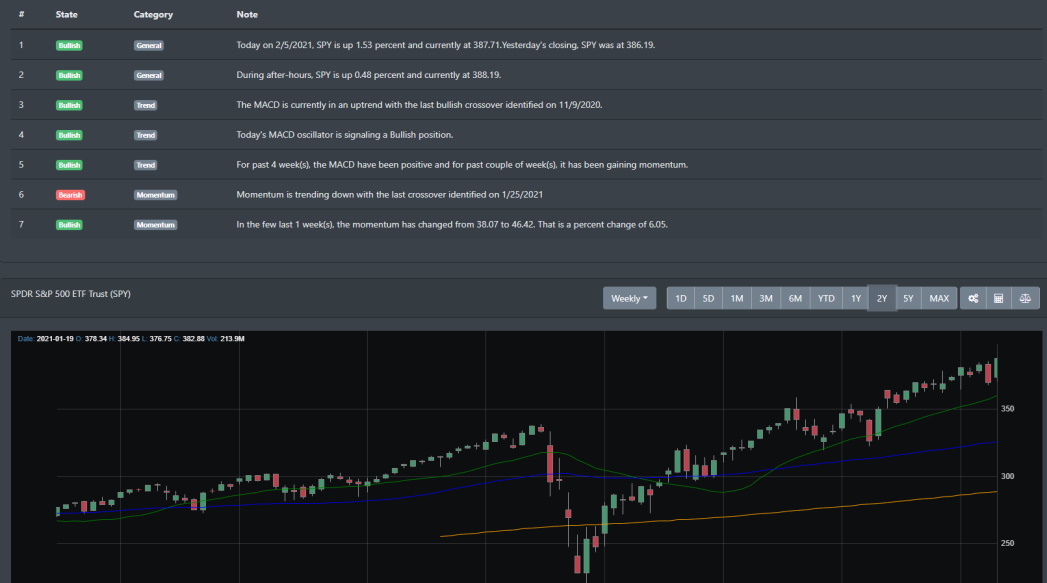
SPY
At the beginning of January, SPY was meandering and trying to find support. By the end of January, it has pushed into new highs.
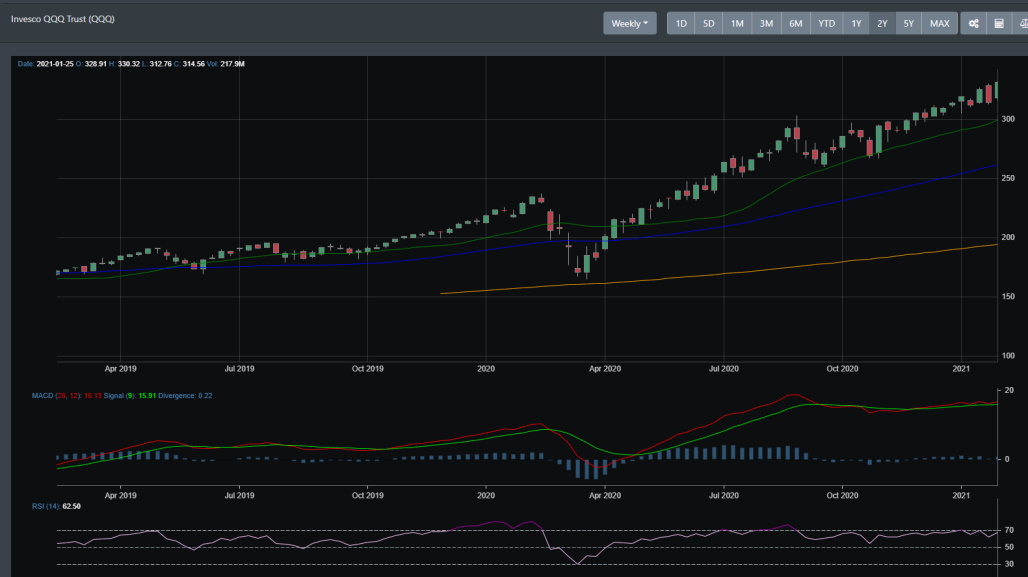
QQQ
QQQ has had a volatile January but is still in a solid uptrend.
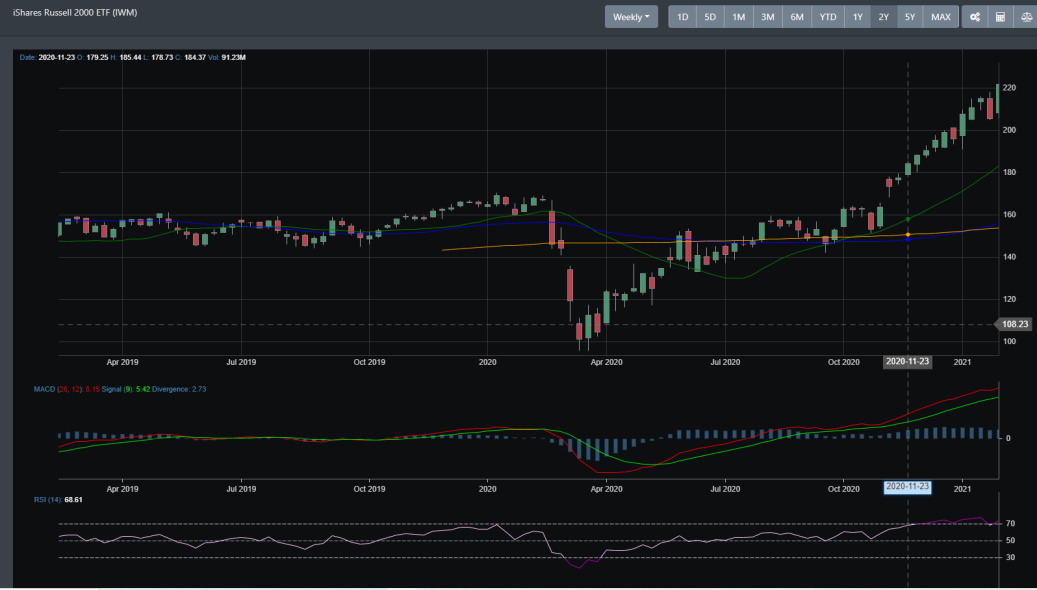
IWM
Small caps are currently in an impressive rally that goes back 11+ weeks. Even with last week's drop, it is right now printing a solid bullish uptrend.
Concluding
A few items are most likely sparking the rally right now. Solid earnings being reported to indicate that companies are moving past the pandemic and Congress preparing to try to pass a new round of stimulus. As it looks right now, the market is setting up for a bullish 2021. With strong market breadth and solid technical support in all major indexes, there seems to be a high probability that SPX reaches above 4100 and beyond this year. The pullback may still be in store as we are now back into the overbought territory but it looks very strong for the bulls for 2021.