


For the first trading day of the year, markets were sitting at all-time highs and technically in overbought conditions. With uncertainty around the Georgia Senate race, the bears try to push the market lower with a sell-off that resulted in all major indices sitting below 2%. Markets quickly shrugged this off as the Democrats swept the Senate run-off in Georgia which opened up the high probability that there will be a massive stimulus package coming in the not too distant future.
Big Picture
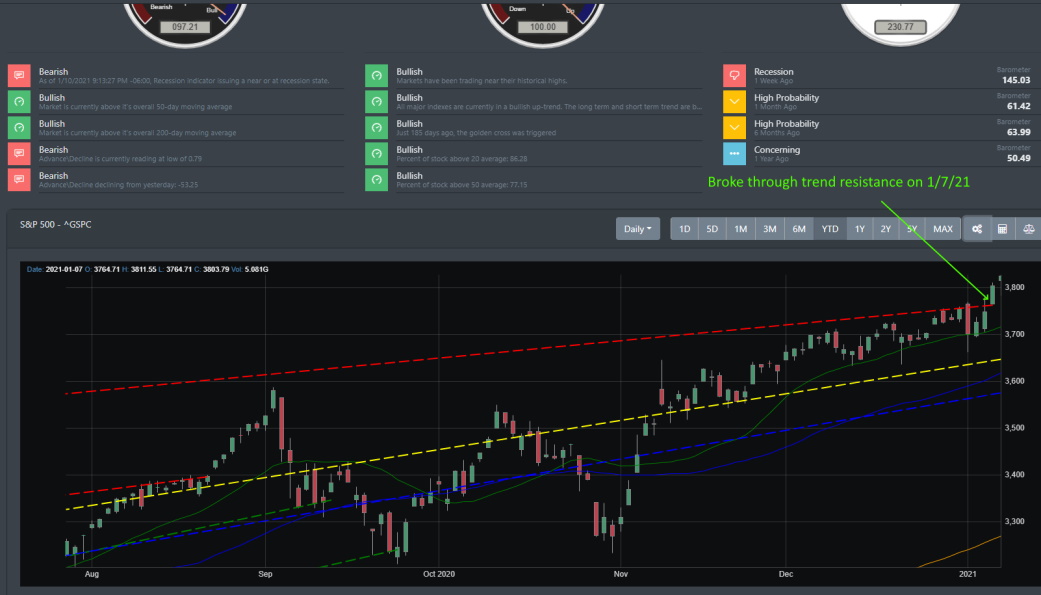
Momentum is back in full swing with BullGap's market direction and pulse clearly in the uptrend. What is even more positive news for the bulls is that on 1/7, the market broke through to our trendline resistance. This most likely was caused by the Blue Wave that is coming down on capitol hill.
Market Breadth
From the last week prior to the new year, the market was in a consolidation pattern. After reaching new highs from November and mid-December, technical readings were in overbought territory. On 1/6, that all changed wand markets propelled itself such that another Bullish Momentum burst signal was issued on that day. A bullish burst signal such as this typically means a large portion of stocks being bought up and market sentiment is at an all-time bullish high.
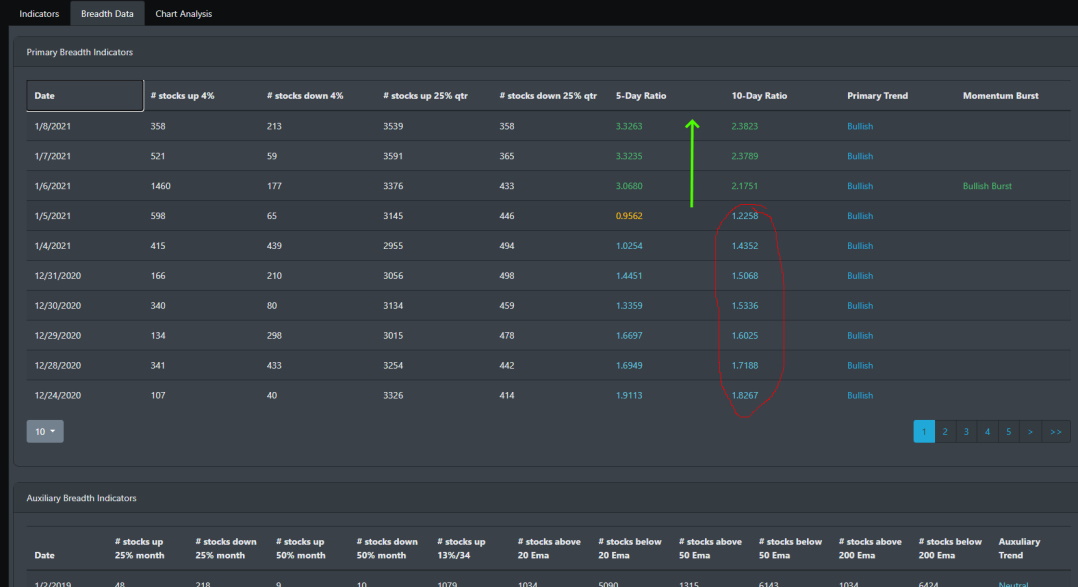
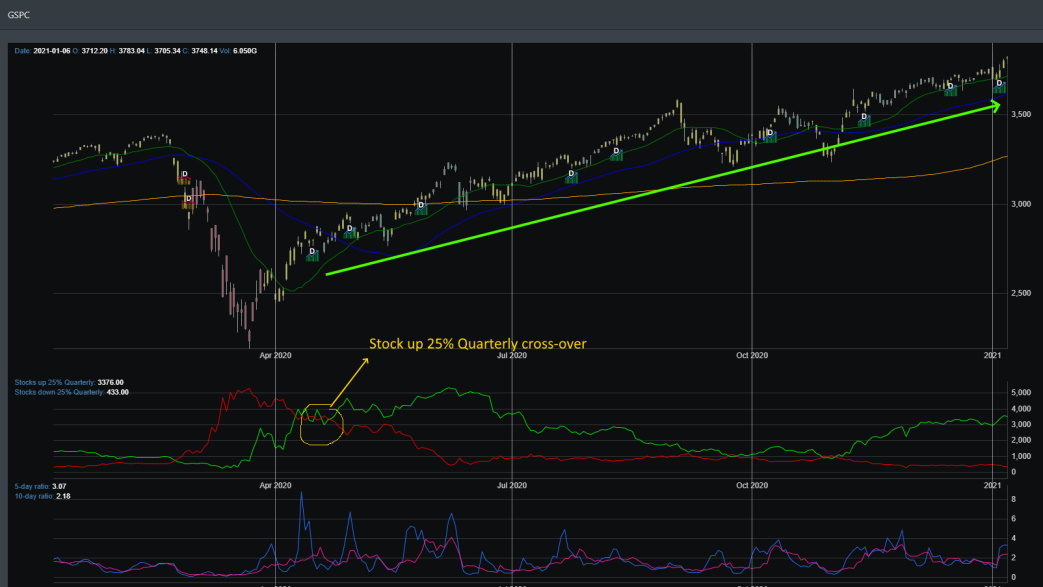
There were a total of 8 momentum market burst signaled by BullGap's Market breadth indicator. In the chart just directly below that, you can see that when the stock up by 25% quarterly crossed over the 25% down, it signal the move the upside. In fact, this signals a move from the prior bearish signal and the bottoming of the stock market. Since that day, the markets have been on an uptrend.
Economic Outlook
As we discussed in several blogs, thanks to the Feds there is ample liquidity in the market. M2 money flow is at an all-time high and borrowing costs are near 5-year lows (See prior blog).
Long Leading indicators
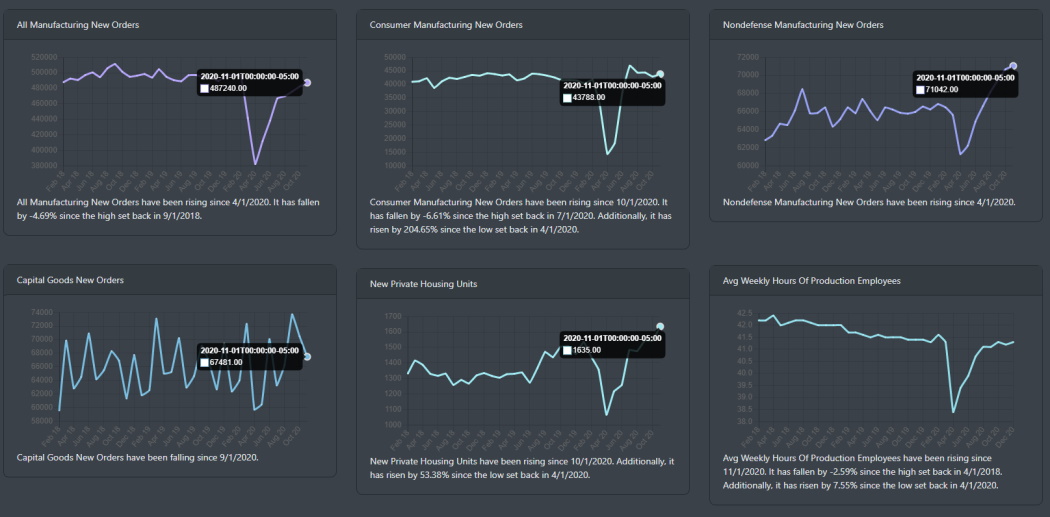
Looking at some of our leading indicators, we can see that both new orders for business and consumer durable goods are at or above their pre-pandemic levels. New housing units and an average workweek of manufacturing workers are all positive.
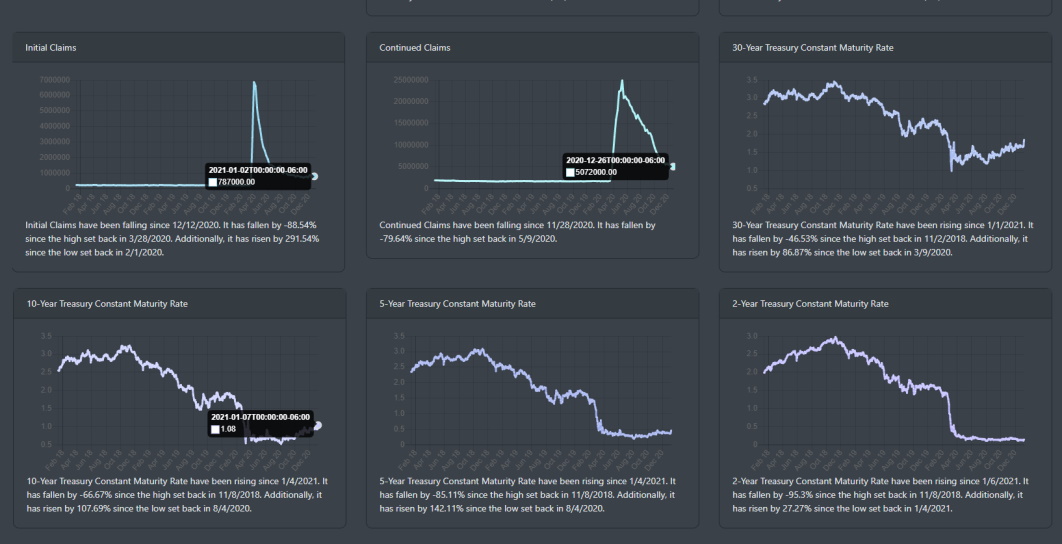
Initial unemployment claims and continued claims have dropped but still sitting at levels higher than 10 years ago.
Market Sentiment
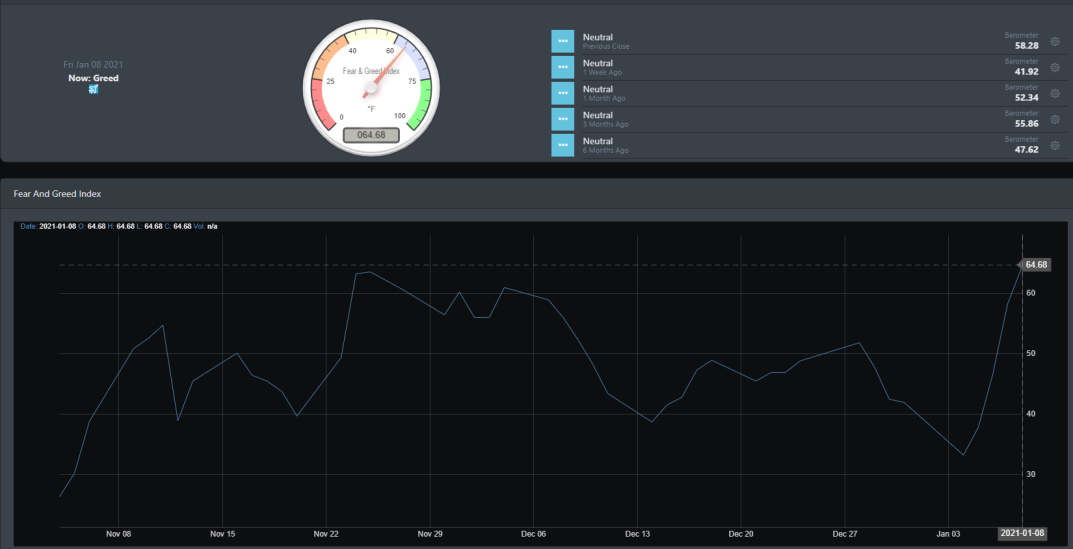
At the tail end of 2020, market sentiment has been neutral. This change dramatically over the course of one week as we can now see market sentiment readings at a high of 64.68.
Market Outlook
Equity markets shrugged off the initial selling pressure on Monday 1/4 to push the market to all-time highs. This week can be considered a good sign for the bulls. SPY, QQQ and IWM all rallied and had solid gains. The treasury market is in a sell-off cycle.
SPY
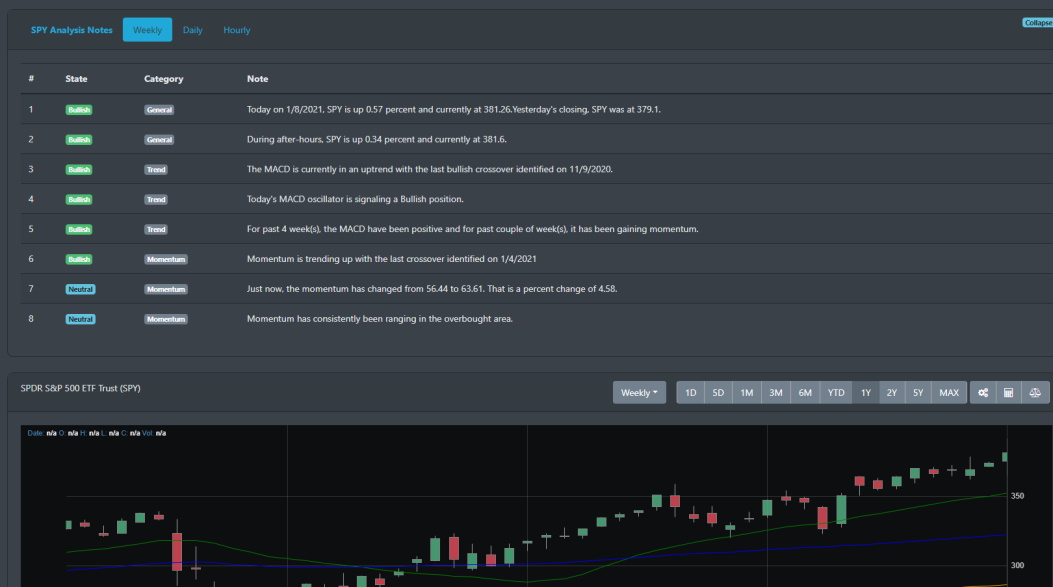
Weekly and daily technical readings on SPY are all bullish with a solid uptrend that started in early November.
QQQ
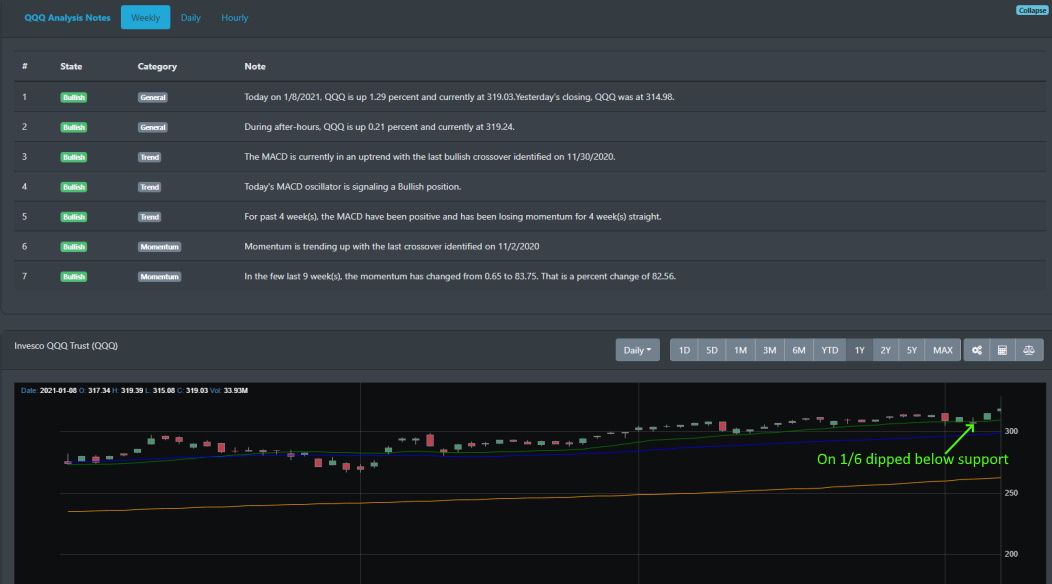
Since dipping below support earlier this week on 1/6, the technology sector also advanced higher and sitting at all-time highs.
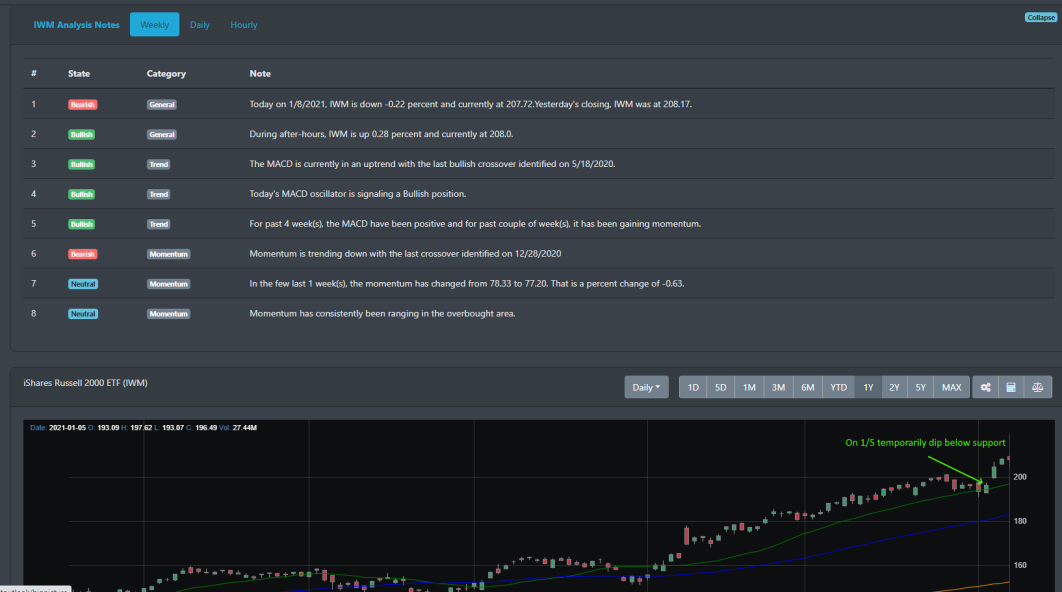
IWM
Since hitting a minor drop in late December, small-caps made substantial gains this week. On 1/5, IWM dipped below its 20 DMA but has since moved higher to close out the week.
Concluding
It is hard to imagine what can stop the market. The sacking of the Capital building, over 3500 COVID deaths a day, ensuing lockings, and increasing unemployment seems to just fall by the wayside. SPY tested its 20 DMA earlier this week and the bears fail to follow through. Once again, momentum right now is on the side of the bulls.