


Markets have rallied off their recent October low to rally this November to make it three straight weeks of solid gains. The Treasury yield continues to fall, with the 10-year Treasury note dropping more than 19 basis points for the week and landing near 4.4%. The S&P 500 and Nasdaq are nearing their all-time highs, with the Russell 2000 showing strong performance for the month. Overall, the S&P surged +9%, the Nasdaq composite rallied +11%, and the Dow gained more than 7.5% for November.
Much of the backdrop for this month's rally has been centered around the belief that the Fed will end its rate hike in early 2024. The Fed paused rate hikes in late July, and the CPI report reinforced the idea that the Feds will no longer raise rates this year. The inflation rate will likely meet the Fed's target of 2% sometime early next year—possibly Q2 2024. Core Consumer Price Index (CPI) is now reading lower than the Fed's 2% target. It is currently at 1.3%.
But as you know, we never rely on the core fundamentals to determine what drives markets. We have discussed this throughout our blogs. One such one was our last blog regarding our expectations for the markets when it fell in October. Our concluding paragraph from our previous blog, "Markets on the Edge..."
"Markets are at an inflection point. With all major indices closing on Friday under critical support, it is a matter of market sentiment being ready to start a reversal. With the S&P 500 closing right under our support region of 4155, the bulls have to come out and push back above 4155 and maintain support. With the VIX unable to break its near-term resistance and all indices reading oversold on multiple time frames, there is a high probability we will see a counter-rally to start next week. Any further breakdown of the 4155 region could mean markets have finally topped out and suggest we are headed for the 3998 support region. Market sentiment and VIX on the larger time frame have been exhausted, and next Monday looks to be the start of a counter rally for markets."
As we saw, our market sentiment index was exhausted with a bearish sentiment. And this was on many timeframes. Because of this, we expected a rally to kick start that following week - the first week in November. However, we did not expect the bulls to push markets higher for three straight weeks.
Big Picture
Talk about a massive market reversal to the upside. This rally has seen investors moving their positions from a defensive stock posture into Nasdaq and even smaller company stocks. The recent uptrend has helped to improve market breadth while pushing markets higher to where several major indices are near their all-time highs.
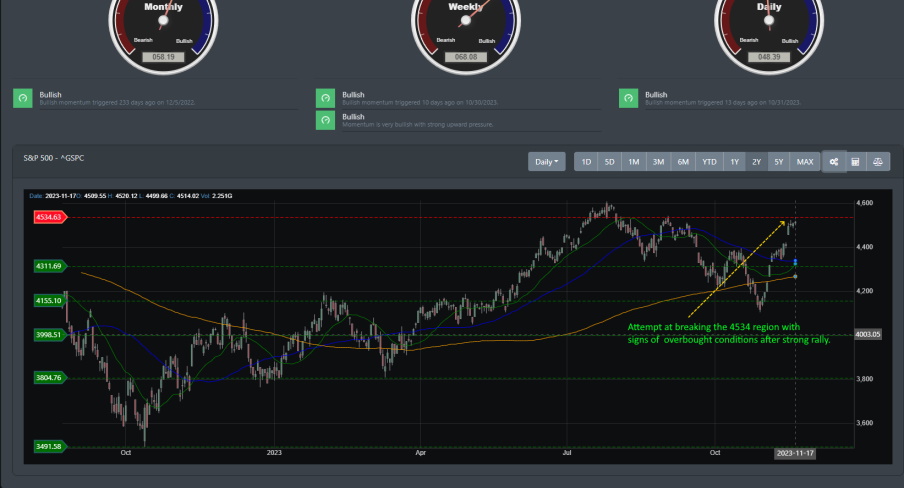
As it sits now, the S&P 500 is right below resistance at the 4534 region. This week has been more of a consolidation as the rally has been unable to break above resistance. Friday's low volume break-out may be an indicator that a short-term pullback is in the cards. Looking at the chart below, it has been nearly a vertical blast off from 4100 to 4500 - all in two weeks. Markets are now highly overbought.
Market Breadth
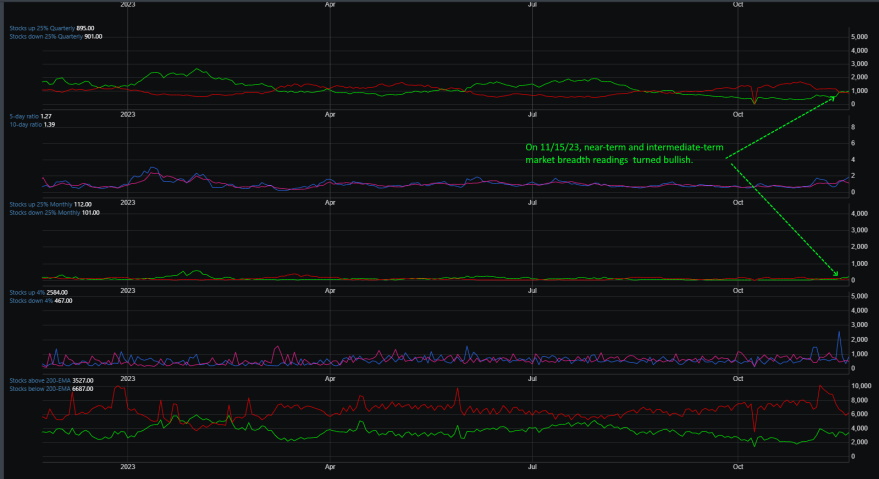
At one point near the end of October, market breadth data had 90% of stocks dipping below their 200 EMA. That said, November's rally has seen a drastic improvement in market breadth, with several beleaguered stocks getting picked up by investors. This has helped turn the near-term and intermediatory market breadth signals bullish. It is only the beginning, but this is a strong indication that the rally that started off at the lows of October 2022 is still intact.
Market Sentiment
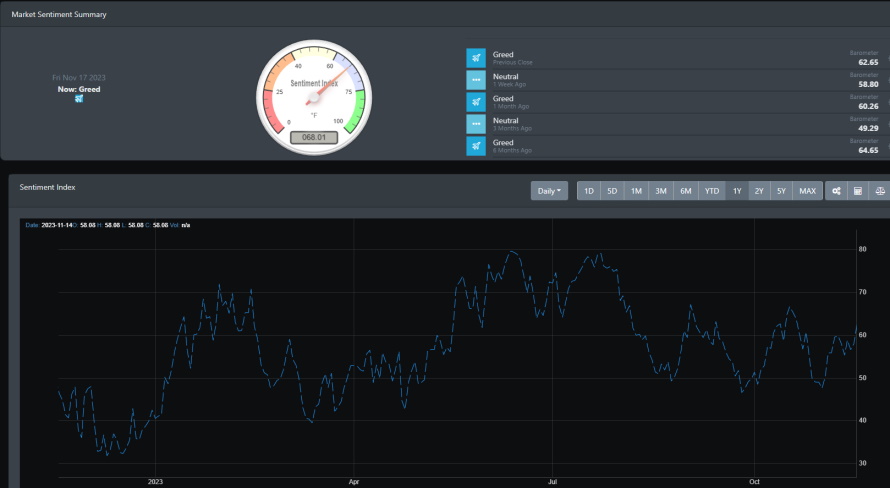
The last time we looked at our market sentiment indicator, it pointed south toward the 40s. At that time, we noted that sentiment oscillated between the upper 60 and higher 40 regions since the beginning of August. And it was reading the low end of that sentiment range in late October. Market sentiment on the weekly timeframe was already highly oversold, and the daily sentiment was nearing a crossover to the bullish side. Well, that next week, sentiment turned bullish, and for the past three weeks, sentiment has encroached upon the upper high 60 reading. Our sentiment indicator ended this Friday with a reading of 68.01. In the greed range. However, there is an increased probability that we will see a reversal, as we have seen for the past few months.
Market Outlook
With markets looking to head lower after breaking critical support in October, markets have had a significant reversal to re-establish the bullish uptrend. As mentioned in many blogs, we always pay close attention to how the Russell 2000 moves when critical support has been broken. Well, the Rusell 2000 (IWM) was good this month. More on that below.
SPY
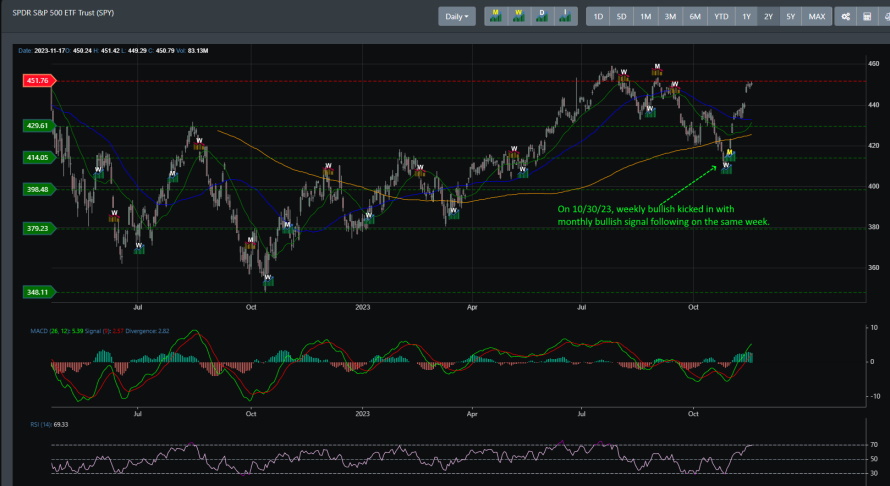
With monthly and weekly bearish readings triggering in August, SPY started to top out and broke through several key supports. The bullish trend that began in October of 2022 was in serious threat of breaking. However, in late October, SPY received its weekly bullish signal. That was followed by a monthly bullish signal triggered in the same week. This technical setup helped rocket SPY to where it has clearly regained the bullish uptrend and is sitting right under resistance at the 451 region.
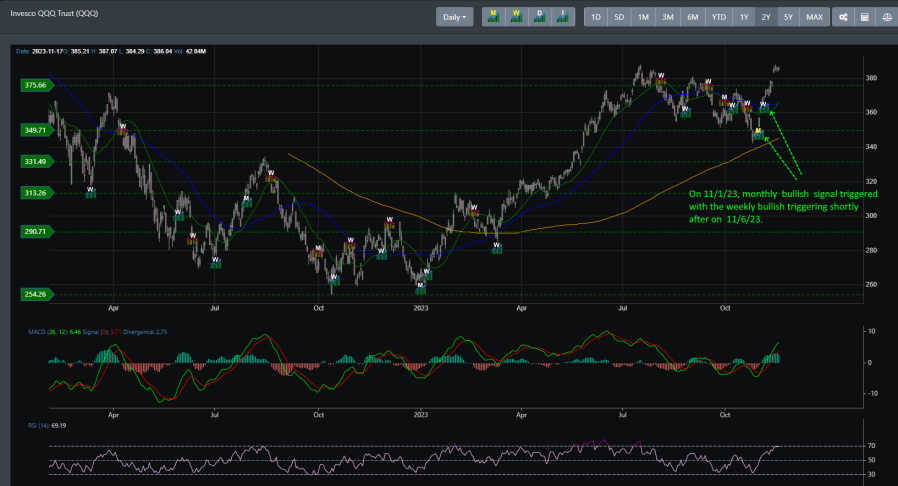
QQQ
QQQ also rocketed after receiving its monthly bullish signal on 11/1/23. The following week, it also received a weekly bullish call to help it push past initial resistance at the 375 region. QQQ is now up against resistance that it could not break back on July 19. Resistance is now at the 387 region.
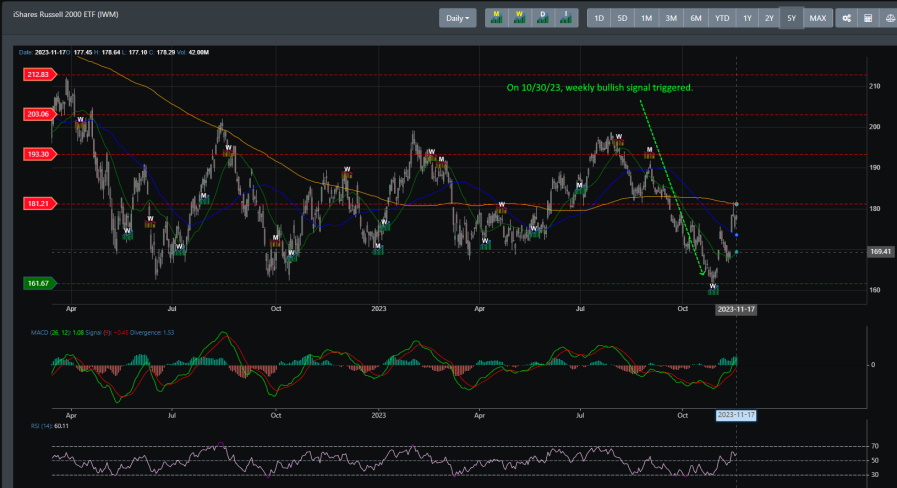
IWM
After making a new low on October 27, 2023, IWM did a turnaround with substantial implications for all other market indices. IWM received a weekly bullish signal on 10/30/23, which has propelled it back to where it now sits right under resistance at the 179 region. It even had a strong move on 11/14/23, gaining more than 5% for the day. A move like this is considered a rare occurrence for small caps, as we have yet to see this kind of move in 2023. Interestingly, the last time we saw a move of +5% for IWM was back on 11/10/22 when it had a +6% for the day. This also coincided with the start of the strong rally we are seeing up to this point.
Concluding
Stocks have surged over the past few weeks and have aligned with one of our recent blogs, where we stated there is a high probability that markets would challenge the 4534 resistance. In this blog, we noted the following in our Concluding paragraph:
"Currently, markets are just trying to hold onto support at the 4311 area. If, in the coming weeks, markets can maintain support at the 4311 region and rally above it, there is a high potential for markets to challenge resistance at 4534."
That was back in early October, and markets broke support, but the setup we saw holds true today. Right now, the S&P 500 is sitting right at 4514 on Friday's close. IWM is right under the 179 region. And even QQQ is sitting right below 387 region. Though all major indices are right up against resistance, there is a good chance that we see markets go higher next week. However, with a strong rally, market conditions are highly overbought. There is also a high likelihood that a FOMO topping is near where we will get a much-needed pullback to release the overbought conditions.