


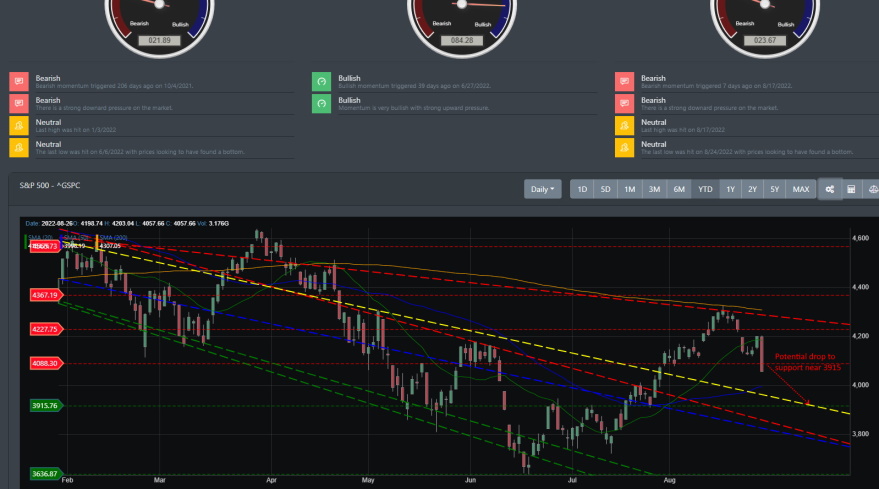
Markets have been in free fall since hitting resistance in mid-August. The rally off of the June low setback in 6/23 helped propel markets right up to the 4300 region. And as we mentioned a few weeks ago in our last blog, we were expecting a pullback. FOMO kicked in gear near the tail end of the rally but the technical readings were hitting the nosebleed into reversion territory.
In our last blog, we stated "But in the near term, markets are now in overbought territory and technical readings are indicating a topping is nearly in place. The pullback will test support near the 4088 region. If support cannot hold, the next stop will be at the 3915 support line."
Market pundits have suggested that the recent Fed meeting is the reason for the market drop. Chairman Powell's statement during the Jackson Hole meeting provided no new revelation. He simply stated what the Feds have been stating for most of the year. Short-term rates will remain high in the near term to stave off the inflation rate. The bears are using the Fed meeting to jump on the recession bandwagon. But if we look at the technicals, it is clear that U.S markets have already been in a pullback for the past couple of weeks.
Big Picture
Markets have been in a pullback hitting resistance on 8/16/22. In the image below, the S&P 500 has clearly broken through 2 supports with the last break on 8/26. And if you recall from our last blog where we stated the following, "The pullback will test support at near the 4088 region. If support cannot hold, the next stop will be at the 3915 support line."
Support was tested and on 8/26, the S&P 500 closed right under 4088.
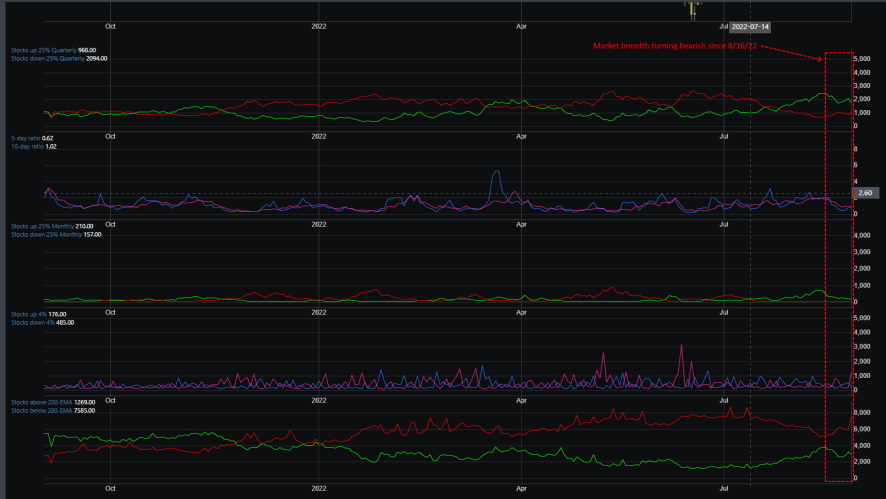
Market Breadth
The recent rally off the June low of 2022, help alleviate some of the bearishness in overall market breadth. In fact, market breadth started turning bullish near the end of July and continued that trend into August. However, that momentum was short-lived as now we can clearly see in the market breadth table below that the near-term strength of the market is turning bearish.
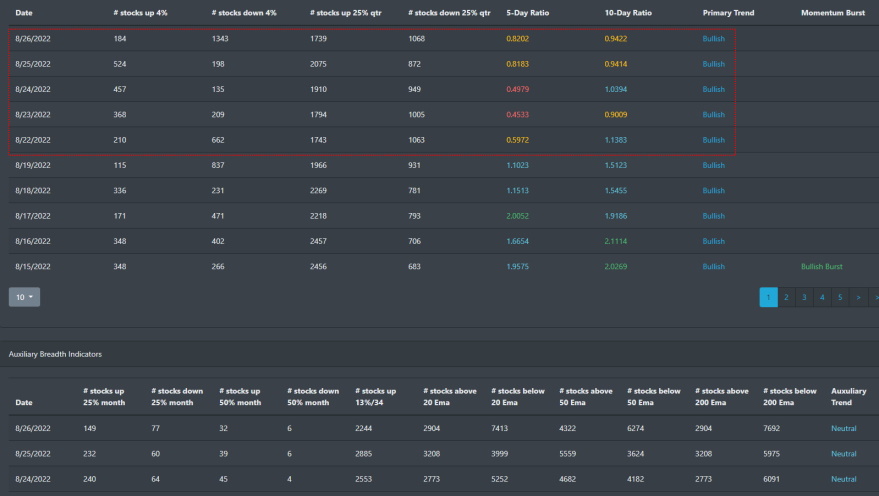
And upon looking at the market breadth chart below, you can see that our main market analytic data for breadth is starting to deteriorate.
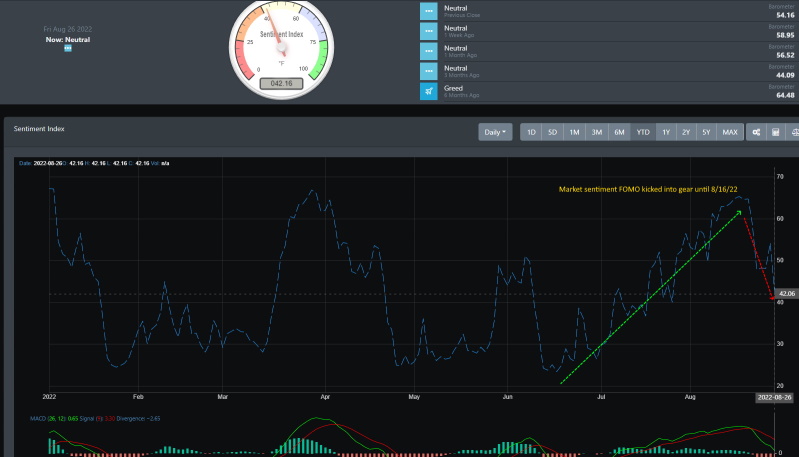
Market Sentiment
Market sentiment has been on one of its strongest ascents of the year since dropping into bear territory for most of the year. There has only been one other bullish sentiment uptrend this year and that started in mid-March and lasted for all but 2 weeks. The average bottom reading for market sentiment for the last 2 years has been reading around 24. That sentiment index reading hit that marker around the time the 6/15/22. Now, keep in mind that market sentiment readings that hit a low range can stay in this area for some time. This typically occurs when the overall investor attitude toward the market is bearish. This event occurred this year between April and May timeline. This also coincided with the S&P 500 dropping over 11% during that timespan. As we can see now, investor sentiment has gone from FOMO greed to moving back toward fear territory. The MACD on the chart shows the break in the sentiment as well.
Market Outlook
All major U.S indices are taking a nosedive at this point. In the days leading up to the drop, there was negative divergence on the 60-minute and 5-minute charts showing the potential signs for a near-term topping. Even the daily technical readings were at the nosebleed territory for a topping. For this year alone, the daily RSI never hit above 70 until 8/12/22 and the MACD and stochastic readings were all in overbought conditions. Our momentum indicator which is used for our Market timing service was near a bearish reading.
Additionally, the TrendFinder algorithm issued this week a weekly sell signal for SPY, QQQ, and IWM. This has strong potential for projecting a drop of the next support line in the very near term.
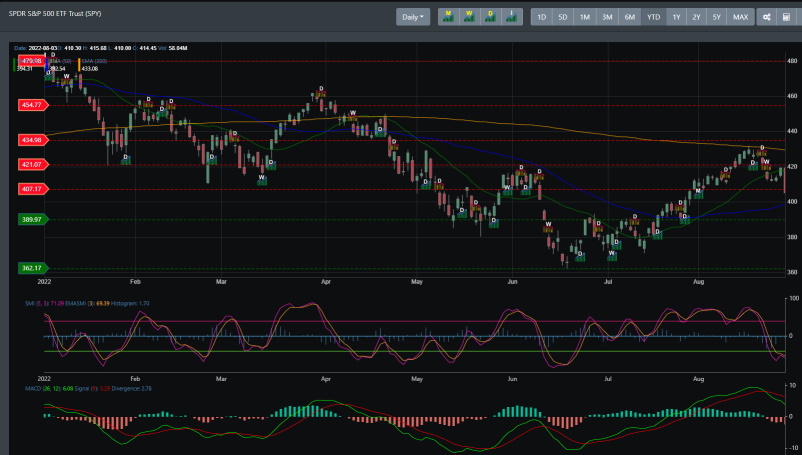
SPY
Coming off the June lows, SPY has rallied through several resistance lines. You can see that right on 8/16, the bulls failed to break above the 200 DMA line. Having failed this resistance, SPY started to turn over bearish. Both the stochastic reading and the MACD on the chart crossed over to the bearish side. An even more bearish reading is that SPY on Friday fell through support at 407 and fell under its 50 DMA.
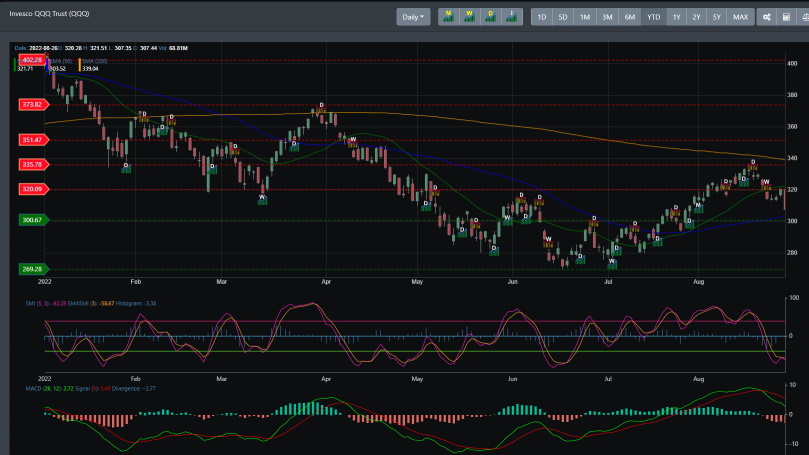
QQQ
Like SPY, QQQ also has turned bearish with technical readings crossing over to the downside. Unlike SPY, QQQ did not have a test of the 200 DMA but failed to break its resistance near the 335.78 line. With the break of resistance on 8/17, QQQ has now broken through its 320 support line. The next immediate drop for QQQ is near the 300 region.
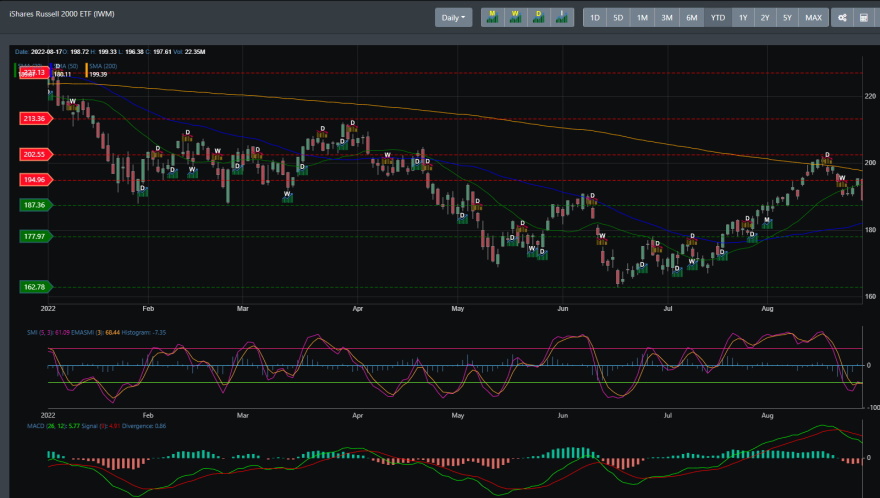
IWM
IWM lead the rally from the June low but it finds itself in the same bearish reading as both SPY and QQQ. In mid-August, IWM was able to challenge its 200 DMA. Unfortunately, that was short-lived as it has now broken through support at the 194 region line. It also is looking at a retest of the 187 region line.
Concluding
Having pushed into FOMO territory and rallying off the June lows, markets are back into oversold territory. Does this indicate a bottom yet? With our algorithms issuing a weekly sell signal on the major indices, it looks like there is going to be more downside in the very near term. SPY, QQQ, and IWM have a high potential for a retest of their next support line. This coming week could see the retest of that support.