Easily find momentum stocks that will allow you to profit within a week timeframe. The End-of-day momentum strategy finds assets that are prime to move up in the next few trading sessions. For day and swing traders who want to go long or short on a stock and exit within the next few days for a profit.
The End of Day (EOD) momentum strategy finds assets such as stock, crypto, forex that have a high probability of making either a move up or down within the next few trading days. The strategy is to hold the assets for the defined number of trading sessions which is by default no more than a week. The steps to perform these trades are as below.
- At the end of the trading day (5PM CST), our EOD trading model will have identified all possible assets (stocks, ETF, crypto, forex) for the day that have a potential for a move higher or move lower.
- Log into MogulUp app and look at the EOD scanner results. Sort by the most recent signals and review the trade action (long or short) and back-tested probability of the trade signals.
- Pick an asset to go long (buy) or short.
- Wait for the next trading session that emits the sell signal.
From there, you just repeat Step 1.
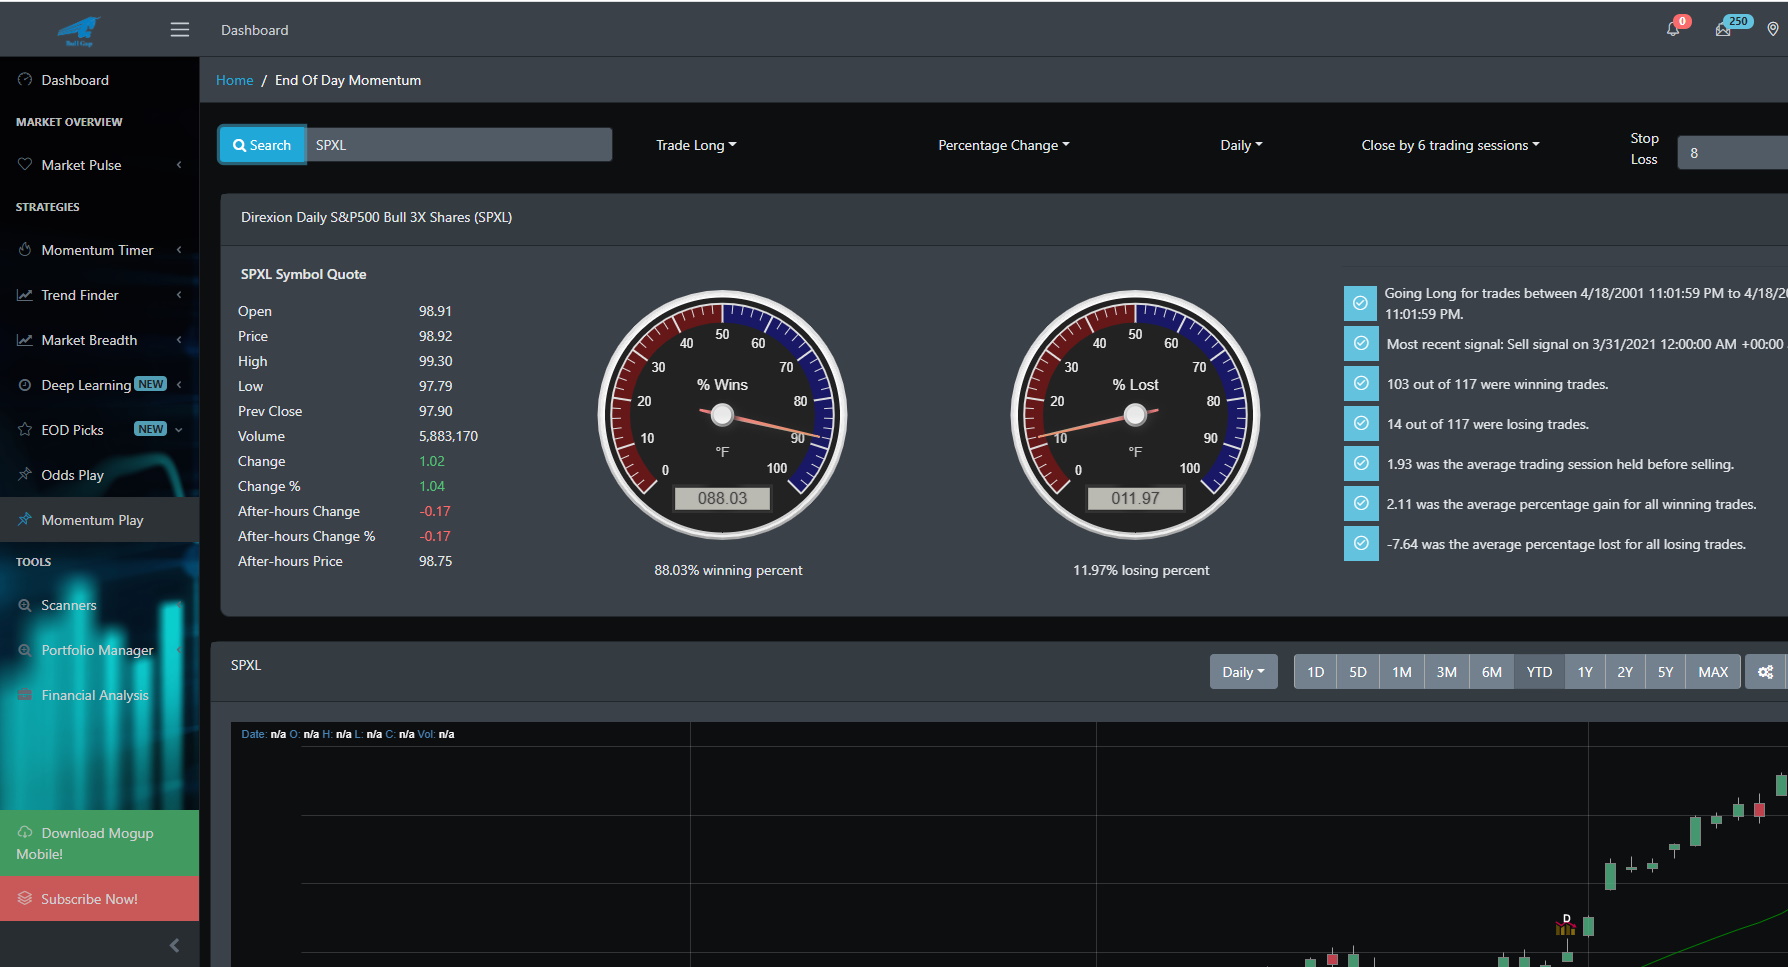
End of Day Dashboard
Below is the dashboard from which you can view any stock, ETF, crypto, forex asset. In the screenshot, we are looking at SPXL which has a 88% chance of giving you a profit when there is a buy signal. Simply buy the stock at the close and wait for the next day (up to 6 days) for the next sell signal. Out of 117 trades identified for SPXL going long, this strategy has made a profit 88% of the time.
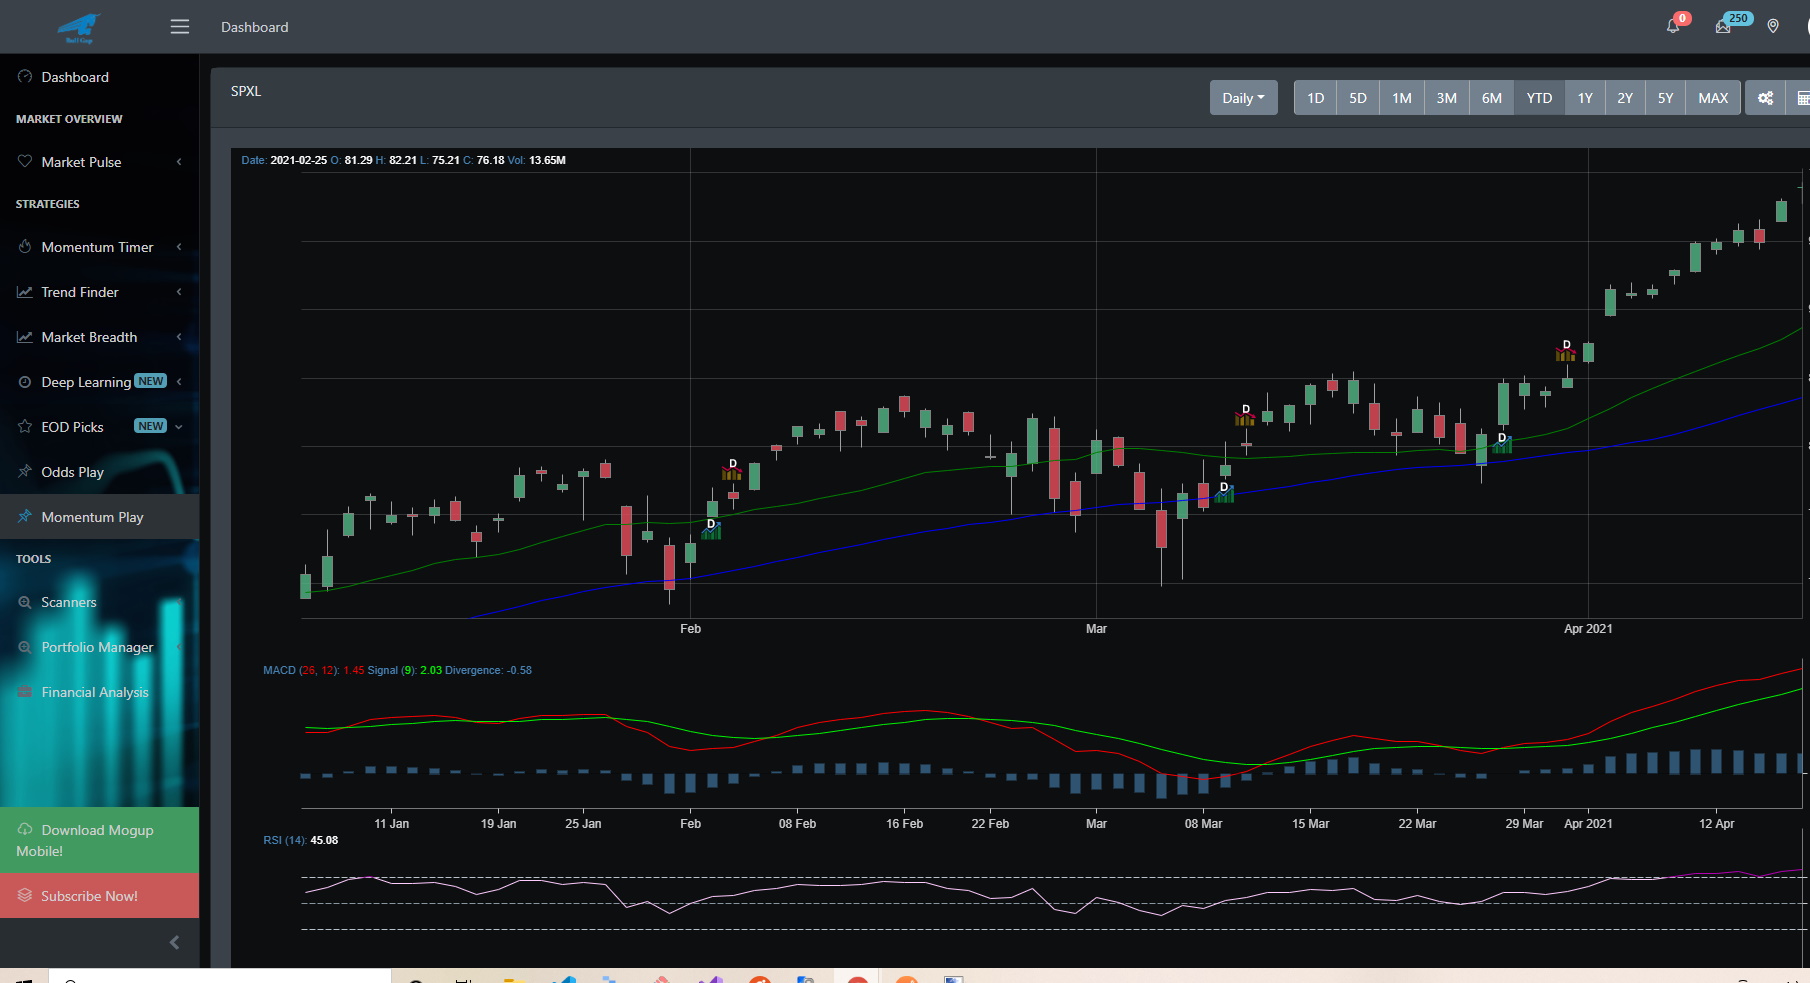
Below is a chart of SPXL with their respective buy and sell signals. Notice, that the buy signals actually identify strong momentum that would allow you to potentially hold the stock for a longer duration of time.
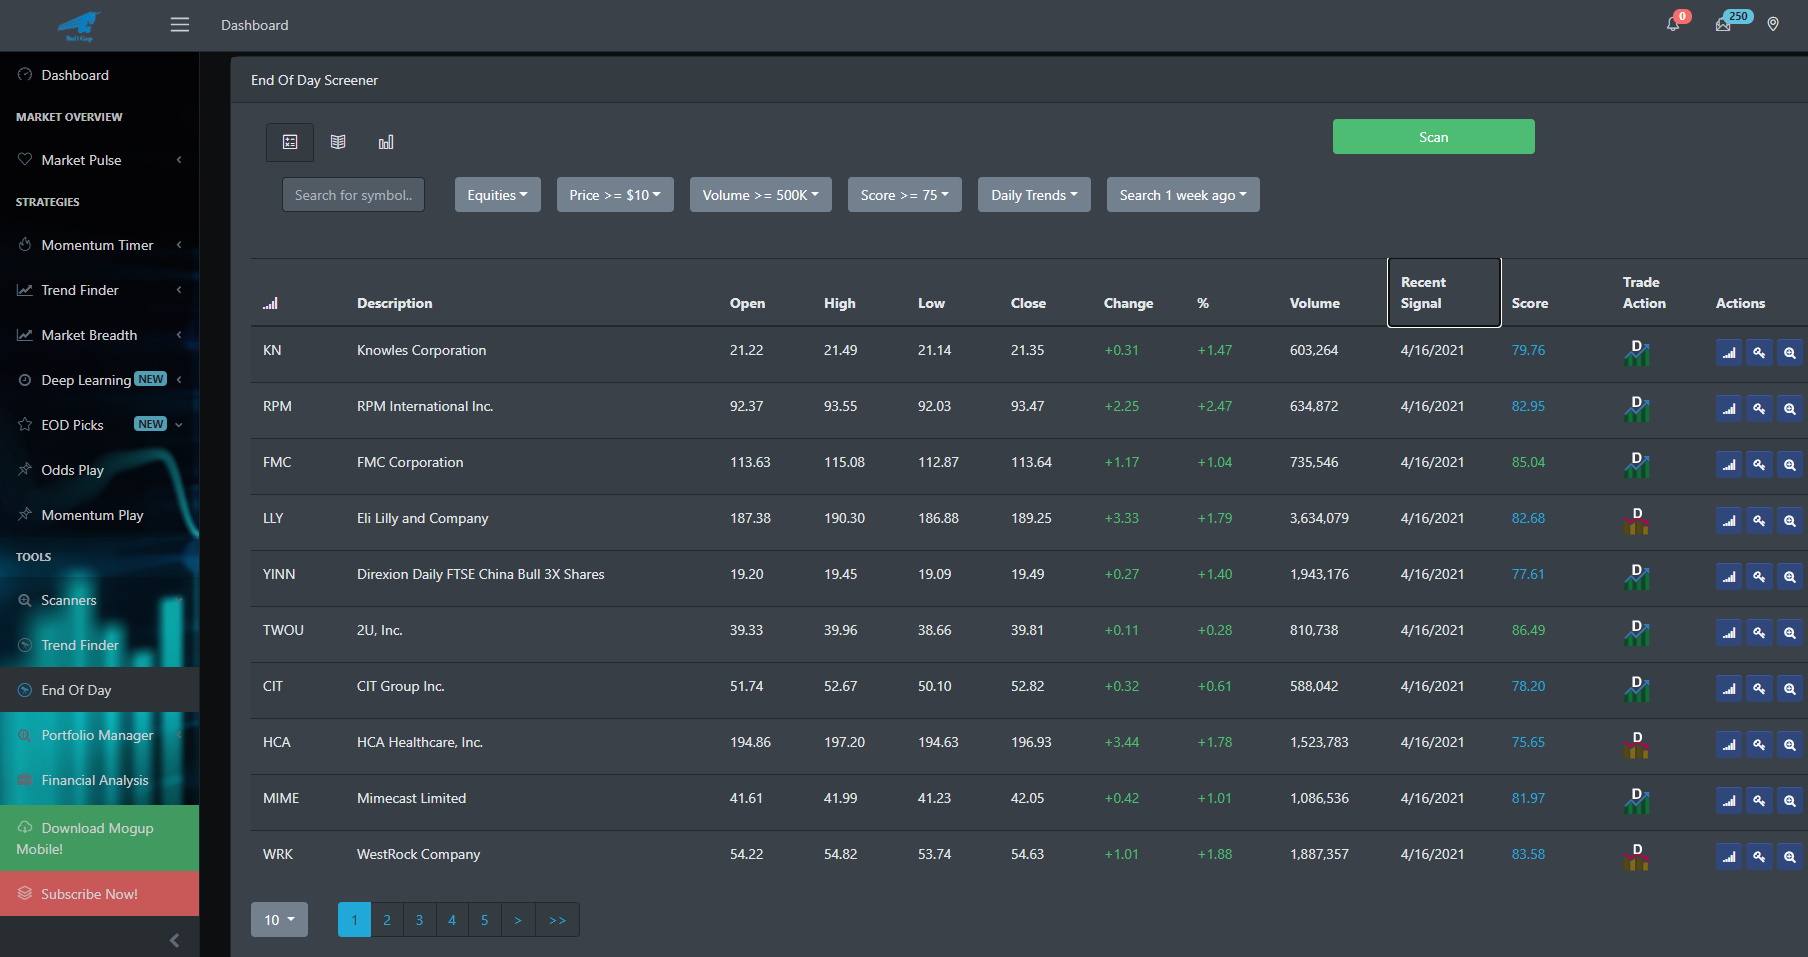
End Of Day Screener
The screener dashboard provides you with all the available assets that signaled a buy and\or sell signal. You can sort by the "Recent Signal" column to get the most recent signals for the day. Use this to identify the end-of-day buy and sell signals that you can go long or short on.
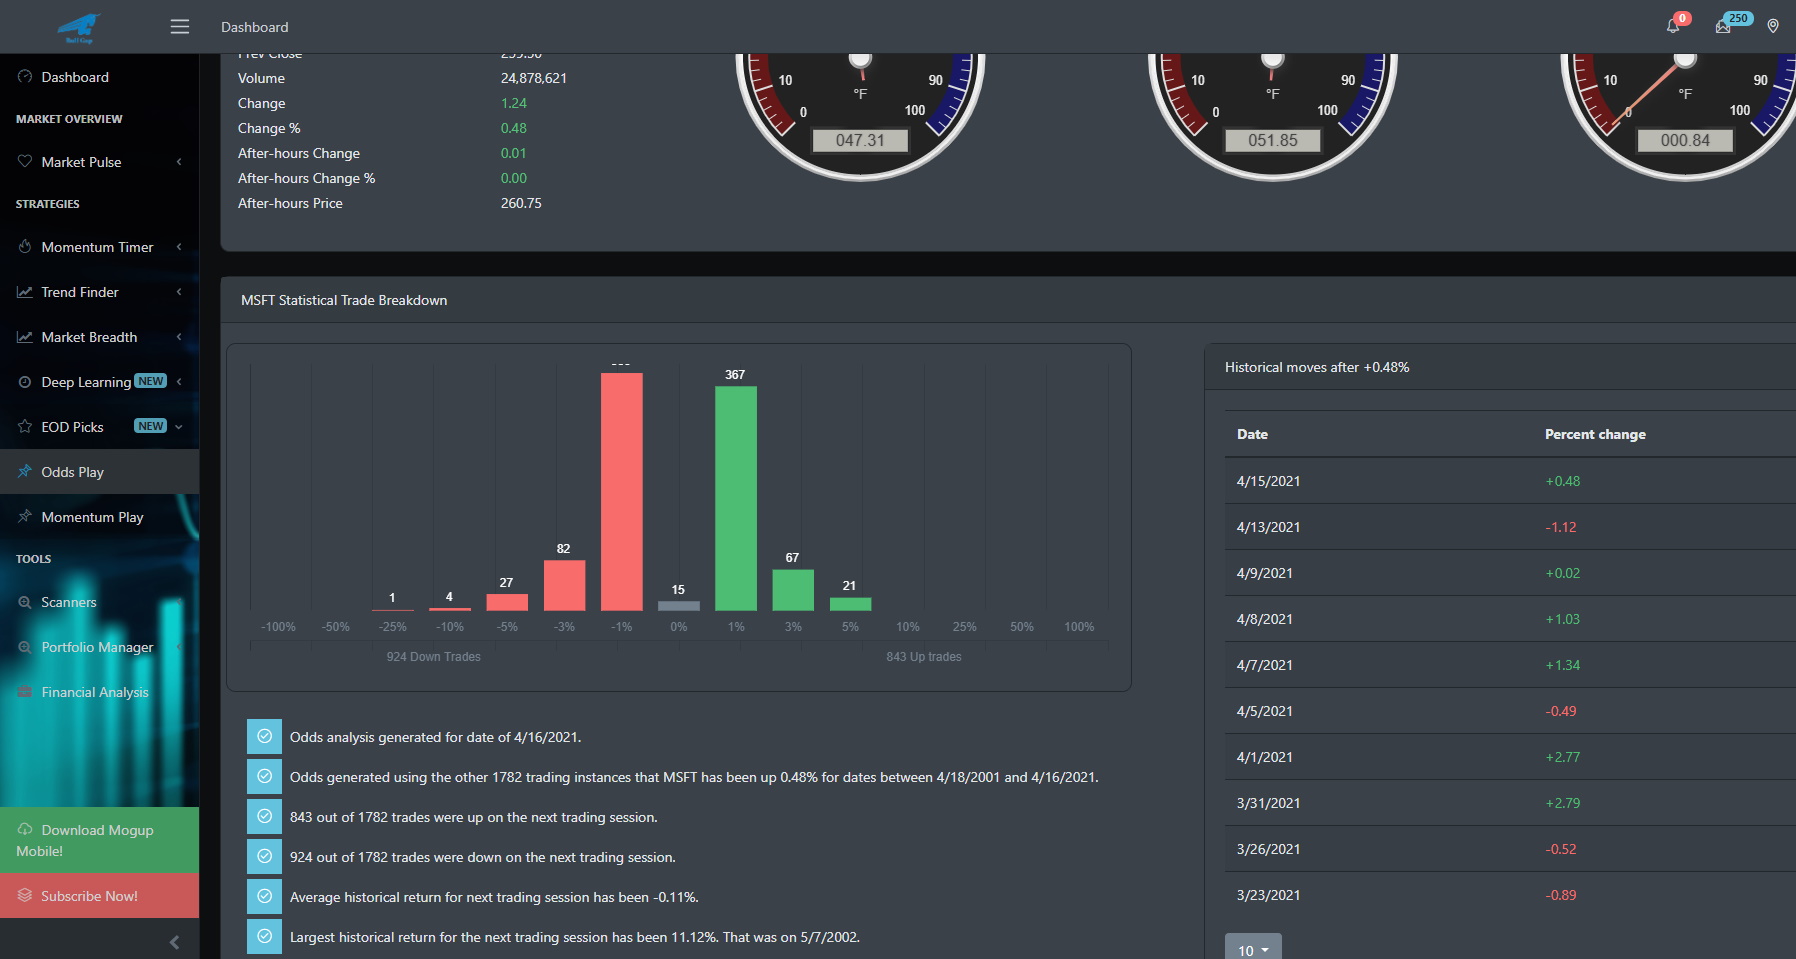
Historical odds breakdown
Additionally, you can review the historical odds that any given asset has either moved up or down on the next trading day. The image below is an odds play on MSFT (Microsoft) where we see it is up +0.48% for the day of 4/16/2021. Based on the historical price action movement, MSFT has a 51.85% chance of moving down on the next trading session day (4/19/2021).