New feature updates! Dynamic Fibonacci Support and Resistance
BullGap has released a new set of powerful tools that will allow anyone to diagnose trends with dynamic support and resistance. Mogulup app users will now be able to apply the following features to any one of their favoirte set of stocks, crypto currencies, forex, ETFs, etc
Dynamic Fibonacci Support and Resistance
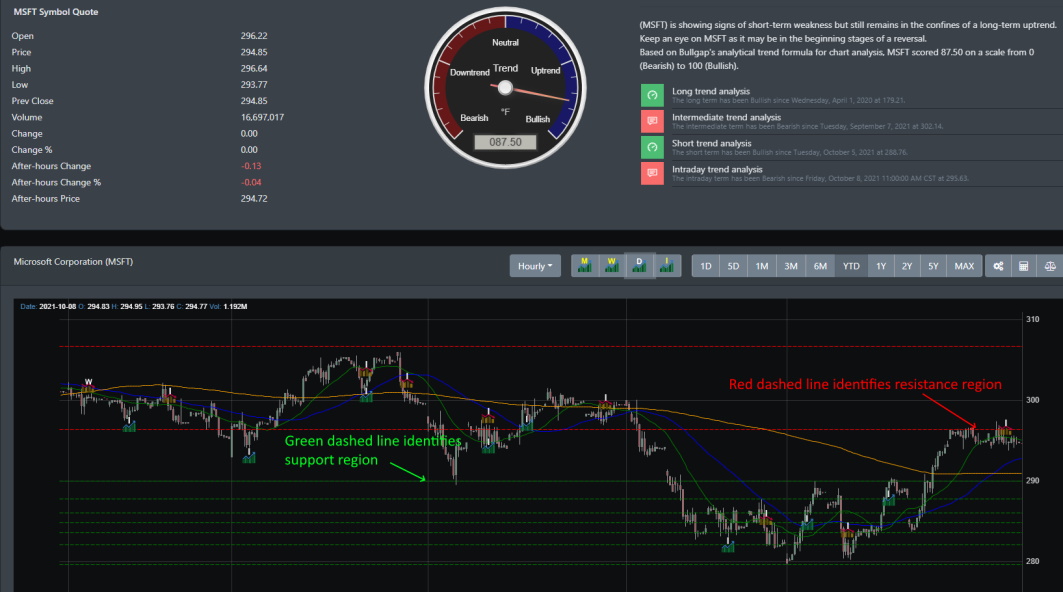
With the dynamic support and resistance, you will now be able to view any market data in realtime and get the current Support and Resistance regions to help identify market trends. In the image below, there are 2 levels of resistance (red-dash lines) for MSFT (Microsoft) and several levels of support (identified by green dashe lines). Notice that the most recent candlestick data shows Microsoft failing to break through resistance and there is now a intraday sell signal for it. In this case, there is a high probabilty that it could move right down to its first level of support.
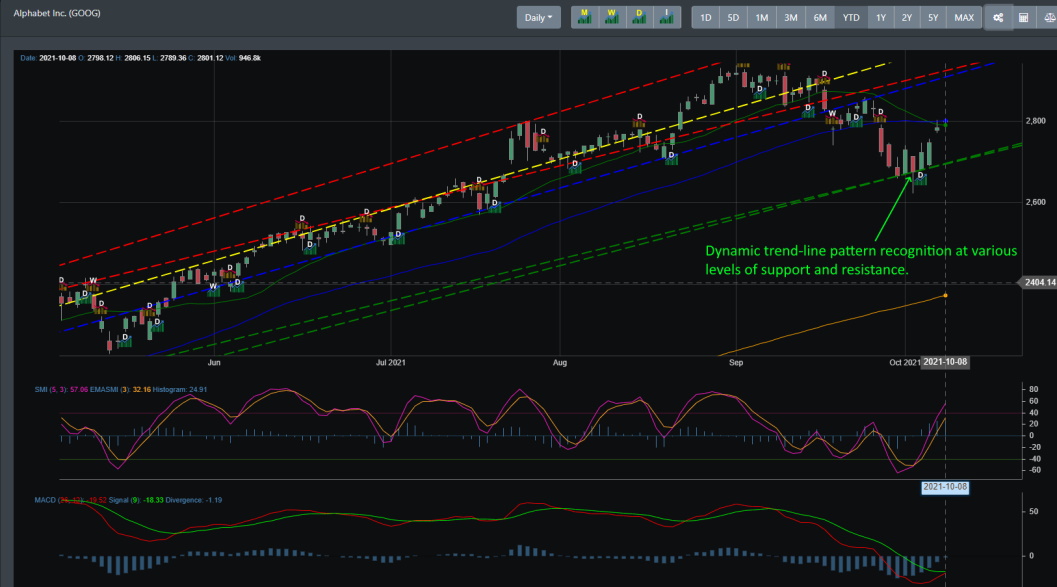
Automatic Trend line Pattern recognition
Do you find it hard to identify trend lines for your favorite stock, forex or cryptocurrency? Now, you can use the automatic Trend-line pattern recognition to help you identify trend direction. Notice below where Alphabet (GOOG) fell below the average support line (blue dashed). Typically if this occurs, there is a high probabilty that GOOG will fall to meet up with is support line (green-dashed). Afeter falling through its average support line, GOOG does just that and then bounces up. As a trader, you can use these to identify buy and sell entry points.
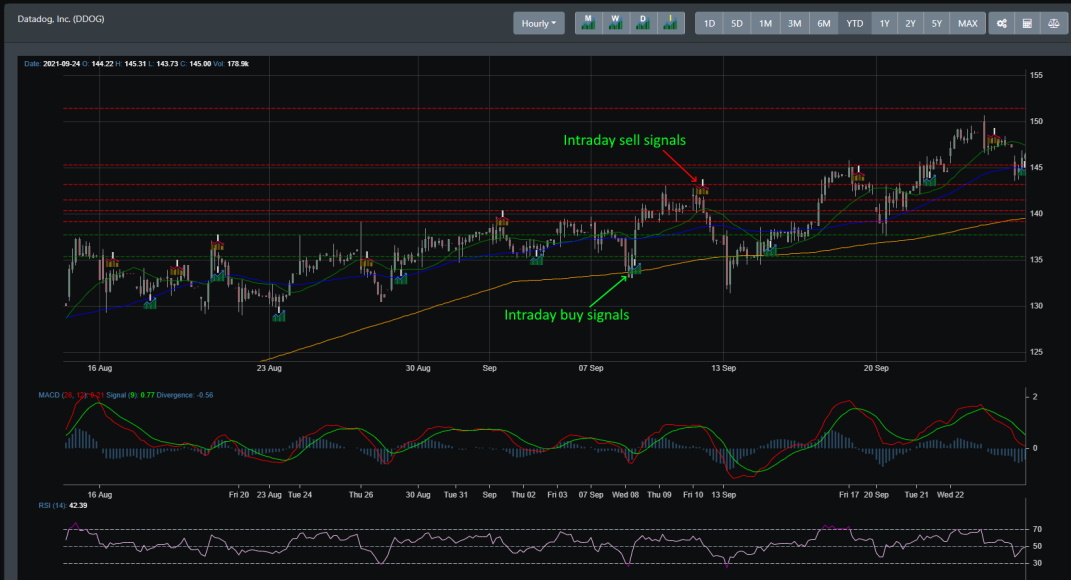
Intraday Buy and Sell Signals (Trend Finder)
Trend finder has now been updated to support intraday buy and sell signals. In the below image, we evaluate Datadog (DDOG) where there are 90% profitable trades for the month of August and September 2021.
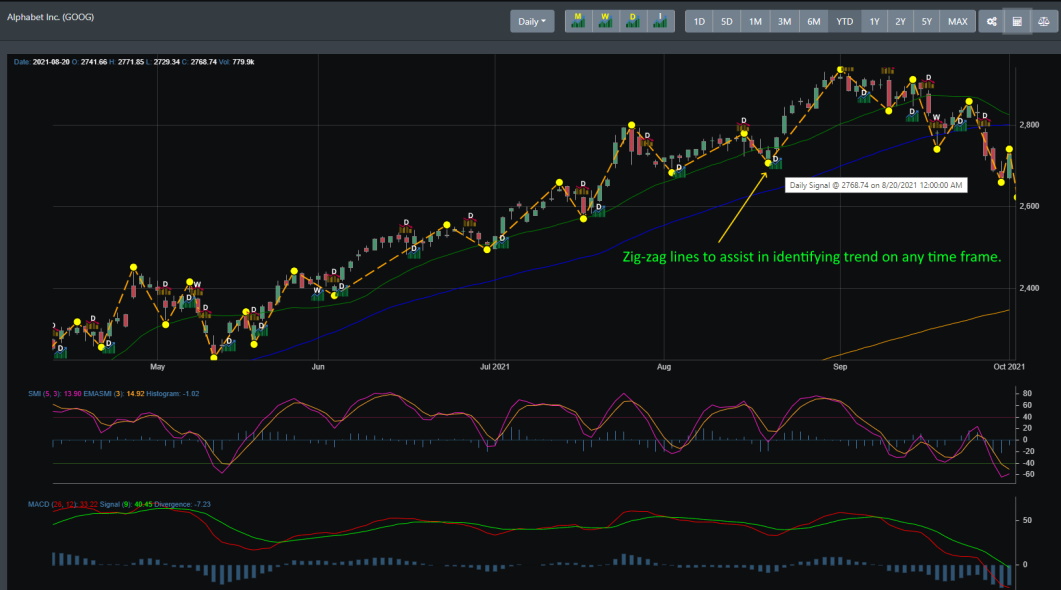
Zig-zag line pattern recognition
Zig-zag line pattern recongition allows you to review market patterns at any time frame. From intraday to daily, week and monthly charts.