


Coming into "Fed week," all major U.S. indices rallied to start the week. The rally helped push the S&P 500 up +2% on Monday and Tuesday. With market participants expecting a 25 basis point rise in short-term rates, shifting from value to growth stock has helped propel the Nasdaq Composite to challenge its next resistance region. However, when markets were looking to rally higher into the final week, Janet Yellen's comment on providing no blanket insurance for bank deposits of 250K+ or more sent bank stocks reeling. Investors bought the rumor and sold the news.
As 2023 currently sits, we have issues with the Fed still wanting to subdue inflation with rate hikes, fears of a 2023 recession, volatility in interest rates, and turmoil in the financial sector. The Feds are in a juggling act of trying to temper market enthusiasm by suggesting there will be no rate cuts this year. They also hope the current banking dilemma will be contained and replace the need for further hikes. With all this gloom and doom in the market landscape, you would have bet markets would have hit their October 22 lows. Instead, the rally is still intact.
Big Picture
At the close of this week's trading session, the S&P 500 is trading higher for the month. In addition, the Nasdaq has made two straight weeks of solid gains, with a 1.3% rally to close out this week. As noted from our last blog, we stated the following about the current market reaching a topping at the time:
"It is just a matter of probability and what you believe drives markets and price action. Markets do not top when everyone is overweight bonds. They typically top out when everyone is overweighted in stocks. That is not the case now, and the technical picture and our algorithm readings suggest a potential for more upside coming in the weeks ahead."
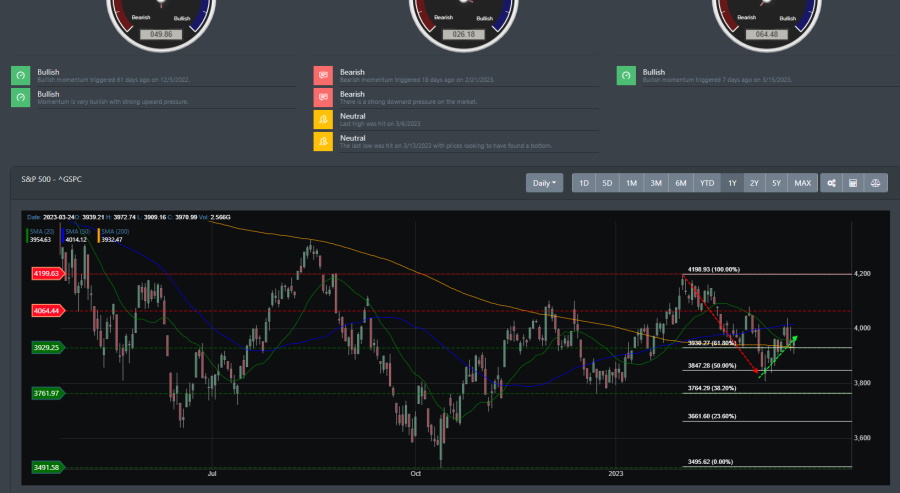
As we expected, markets did have a pullback since we last blogged. Notably, the S&P 500 (shown in the image below) only slightly dipped below its 50% Fibonacci level (support at 3761 region) but was able to bounce back and is now sitting above support near the 3929 region. On Friday, the S&P 500 closed above its 200-DMA at 3970.
Market Breadth
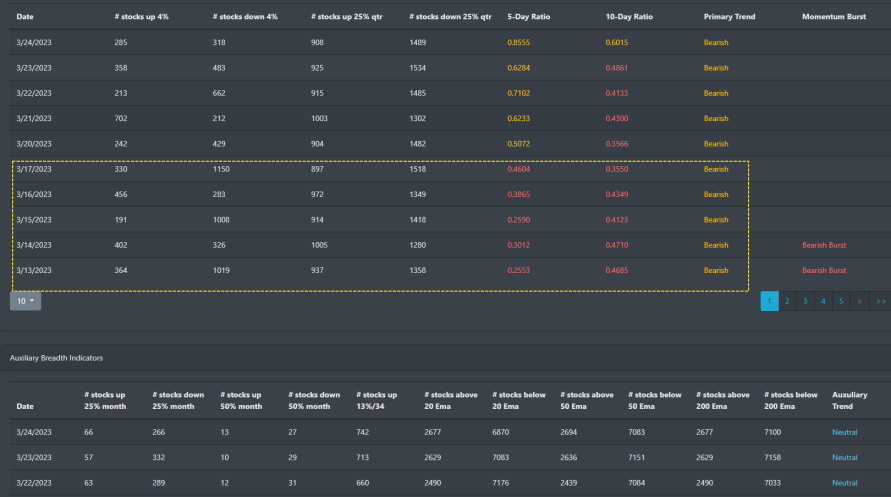
Market breadth has moved into bearish territory since the immediate start of March. The volatility and whiplash price action have been a constant theme for March, with the S&P 500 oscillating between its 200 DMA. Stocks up\down 25% quarterly have inverted to the bearish side, stocks above and below their 200 EMA have remained a good percentage of stocks below their 200 EMA. The rally may be taking a hiatus, but if market conditions do not improve in the next few weeks, then support for all major indices may not hold up.
Market Sentiment
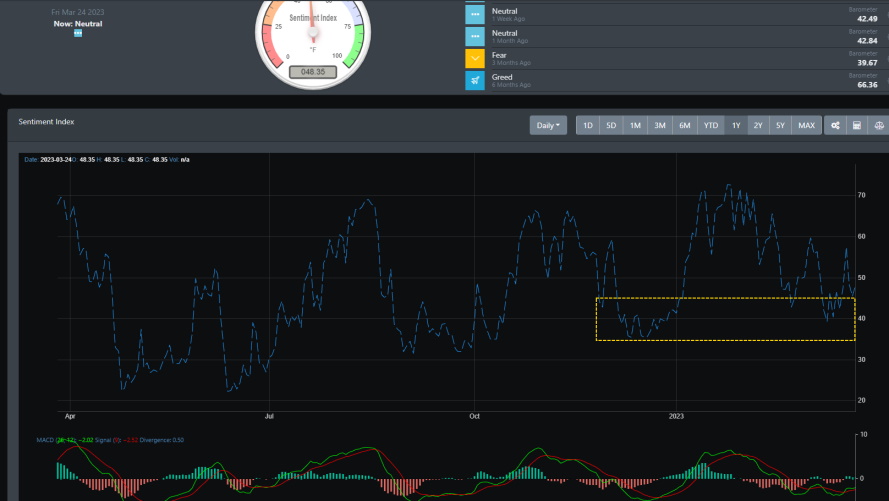
Market sentiment has been mostly neutral in March. From the image below, market sentiment has found a bottom around the 35 to 45 region. The only bullish reading from this is the potential for the MACD to continue on its current bullish trajectory.
Market Outlook
All major indices except IWM have had pullbacks where price action broke initial and secondary support only to bounce and move back to claim their near-support region. IWM, which tracks a market-cap-weighted index of U.S small-cap stocks, is losing ground on weakness in the growth segment, rise in borrowing cost, and potentially further weakness in the value segment. For SPY, QQQand DIA, March price action has seen downward price movement break some key support areas. Still, more recently, there has been a push to move back up to resistance levels.
SPY
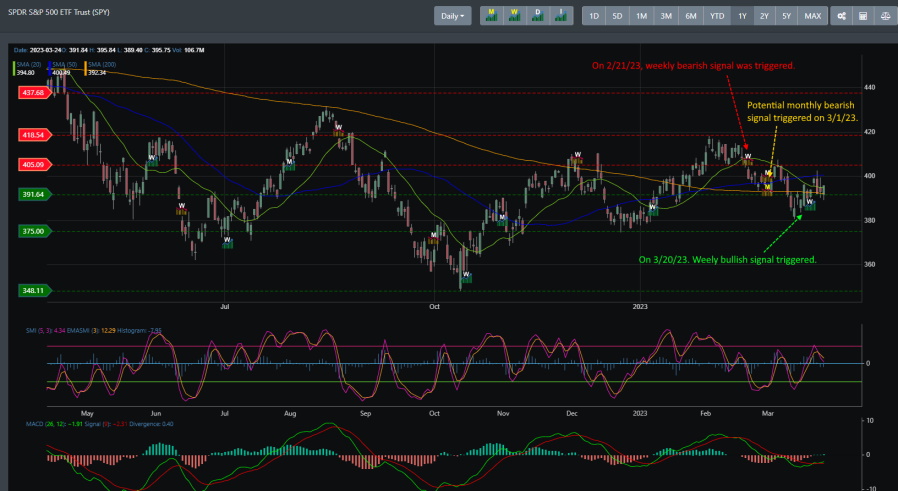
Looking at the daily chart of SPY, we can still see SPY in a rally, coming off of its October 22 lows. Critical monthly and weekly bullish signals triggered a strong push higher in the month of October 22 and right into the beginning of January 2023. Having broken through to crucial resistance lines, SPY topped out in late February and now sits near support at 391.64. Most recently, a weekly bullish signal was triggered this week on 3/20/23. As with our historical weekly bullish signal of SPY, this typically indicates that a strong rally will take place. The only caveat is that with such downward pressure in late February, we also received a "potential" monthly bearish signal indicating a larger weekly timeframe pushing down on market prices.
QQQ
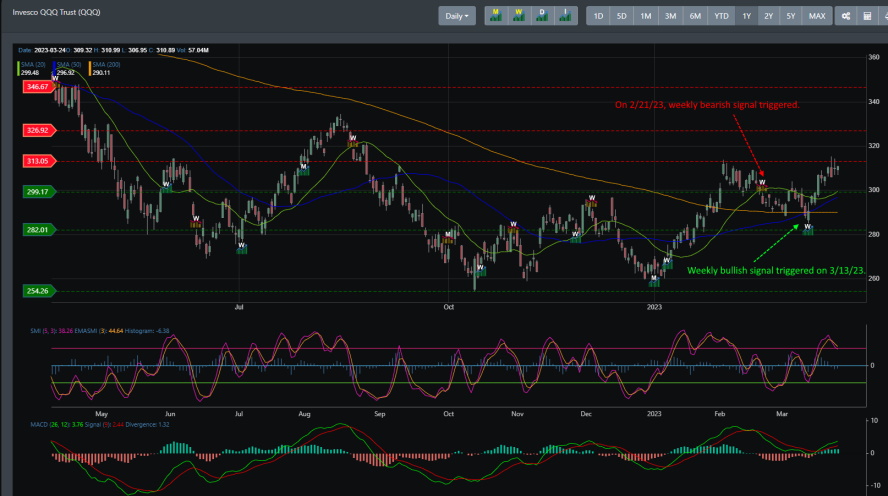
What a difference a year makes for the technology sector. QQQ hit its monthly and weekly bullish buy signal in early January 2023 and has yet to look back. If you look at the price action below, it is clear that the rally in QQQ is still strong. There is currently resistance at around ~313, and the technical picture paints an overbought condition that indicates downward price action to be coming soon. That said, a recent weekly bullish signal was fired on March 13, which is within a monthly bullish signal and indicates the current rally is intact. If QQQ can clear out resistance at ~313, there is a higher probability of higher price action in the coming weeks.
IWM
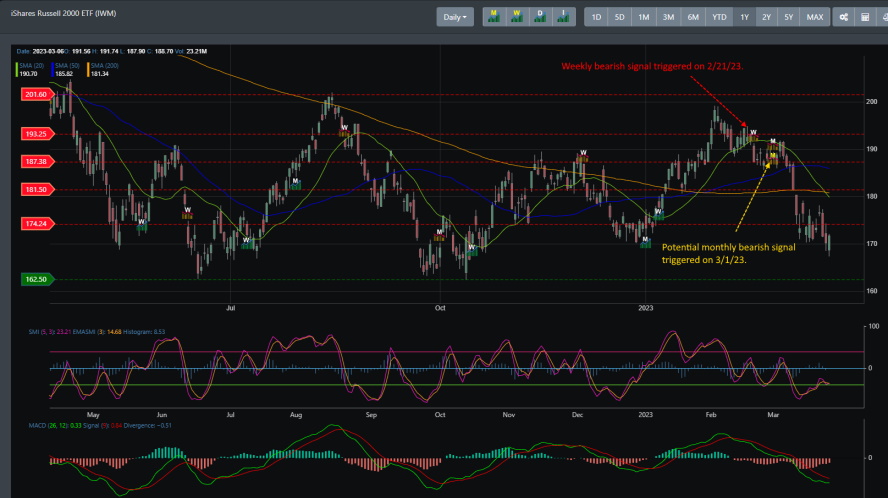
After leading all major indices in October with a solid rally to pull within reach of August 22 highs, IWM has now been hit with a weekly bearish signal and a potential monthly bearish signal. Growth-focused stocks that are interest-rate sensitive have peaked, and with the spike in the Treasury, the yield has been pulling down on IWM. IWM has now broken its support at around ~174 and is looking to head lower and possibly challenge the October lows. While SPY and QQQ have substantial exposure to international markets and high-profit margins, IWM feels the current domestic economic weakness in the U.S.
VIX
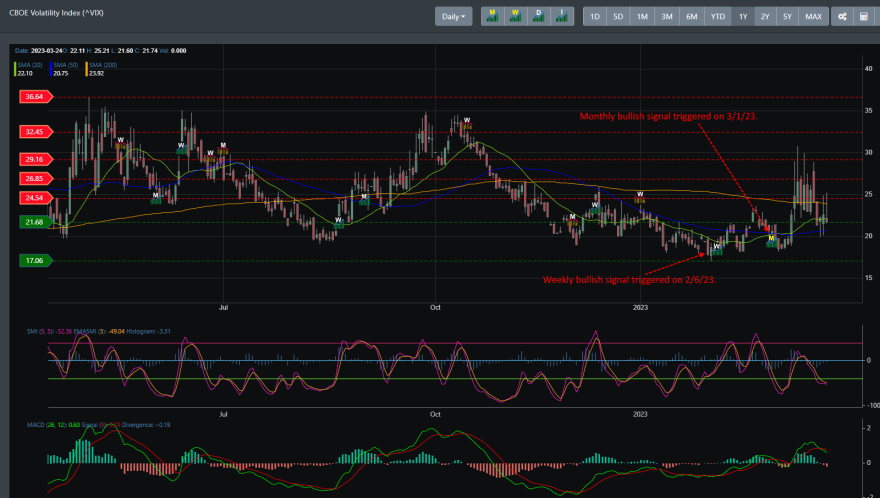
Since hitting its weekly and monthly bullish signal in late February and early March, stocks have been reeling on a pullback. However, looking at the daily chart for VIX, it is clear there is a topping occurring, suggesting that markets have a high probability of rallying if VIX continues to head lower. The daily MACD has already turned over bearish. The overall technical picture shows VIX receiving a weekly bearish signal in the coming weeks. If that plays out, then stocks will move higher very shortly.
Concluding
Despite recession fears and the current banking crisis, SPY bottomed out two weeks ago to form a rally with the bears calling for a bear market rally. The Fed, however, provided a more hawkish stance this week by messaging inflation is less of a threat than when it was back in February by removing the word "ongoing" inflation in this week's meeting. As discussed in our last blog, the recent pullback was expected. The only question was how deep the pullback would be and would the rally resume. For both SPY and QQQ, that looks to be the case, with weekly bullish signals having fired for this week. IWM is still reeling and could draw down the other indices if it does not start to push back higher. Markets will move higher soon as BullGap's Momentum Market Timer has already triggered a buy signal to the upside. The next couple of weeks will be telling to see if the rally continues.