


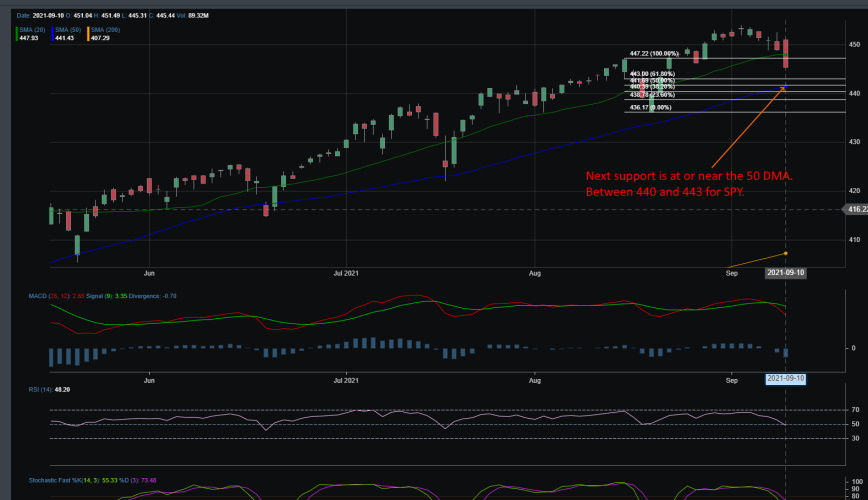
Markets this week had one of their worst slides since mid-February of this year. By the end of the week, the S&P 500 posted 5 consecutive days of negative performance. Strangely enough, markets are only off by 2% of their all-time highs. With the government policy of QE in place, this bull market that began back in late 2008 has still a lot of room left to move higher. It is the simple case that markets are now over-extended and we are coming up on the hour where it will test again the 50 DMA support line.
Big Picture
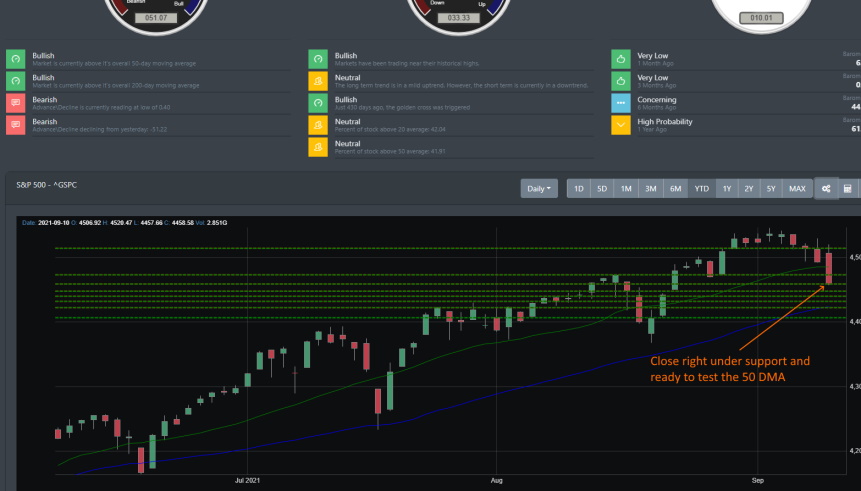
As we discussed in last week's blog, there have been 7 occasions this year where the S&P 500 took a dip. In each of those instances, FOMO kicked in and the bulls started to buy the dip. We are now looking at another dip that is unfolded last week and all signs point to a move lower to test the 50 DMA once again. Will it be deja vu again where dip buys come out in full force to extend the bull market run?
The S&P 500 was encroaching on BullGap's algorithm which set the next resistance at 4548. On Thursday 9/2/21, the S&P 500 almost made that mark at a strike of 4545.85. Having tested the resistance line, markets started to slide and it has now broken through 2 support lines. One at 4479 and the most recent one is near the 4455 support line. If markets do not hold the 50 DMA and breakthrough to the downside, there is a high probability that the next test will be in the 4300 to 4200 support line.
Market Breadth Table
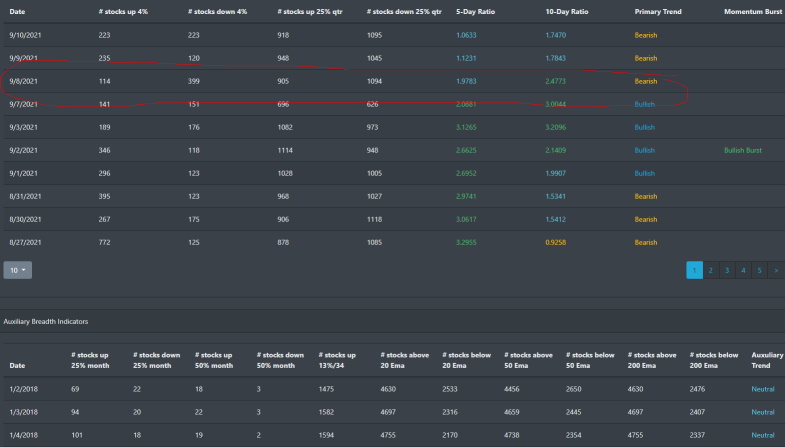
This week market breadth hit a bearish signal on 9/8 where the near-term outlook suggests volatility and downward selling pressure. Market breadth for the last couple of weeks was moving in the uptrend with the bullish burst signal right when markets hit their resistance line. Markets have quickly reversed and breadth data is issuing more downside pressure.
Market Breadth Chart
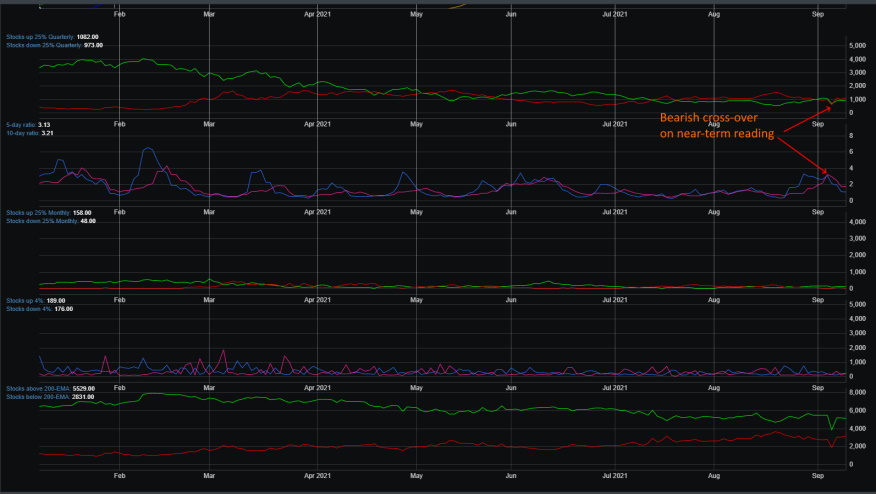
September is already starting to look like September 2020 where markets were grinding higher to only be hit by September's seasonality performance. Markets in 2020 broke the 50 DMA support to close out that month at almost -4%. Unlike September 2020, market breadth for the past 4 months has been narrow with the spread between the number of stocks above 25% versus down 25% being below 500 points.
Market Sentiment
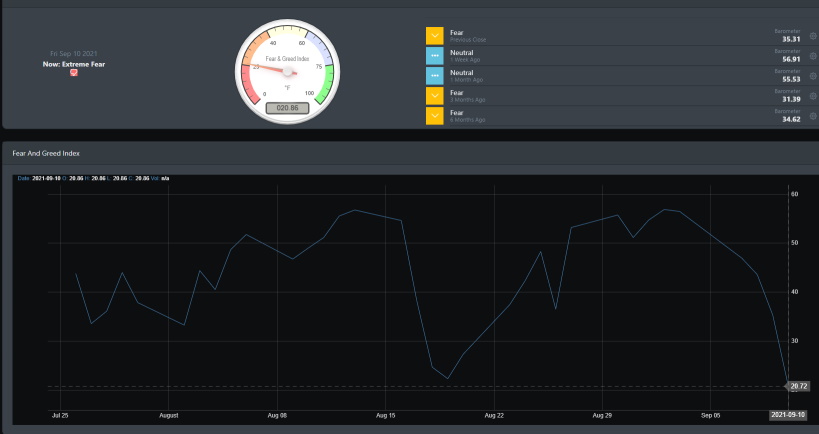
Market sentiment dropped to a low of 20.86 on BullGap's market sentiment index. The last time it was near this level was back on June 18 when markets bottom and bounced off their respective 50 DMA. The S&P 500 is still well off its 50 DMA so there may more room for the downside.
Economic Outlook
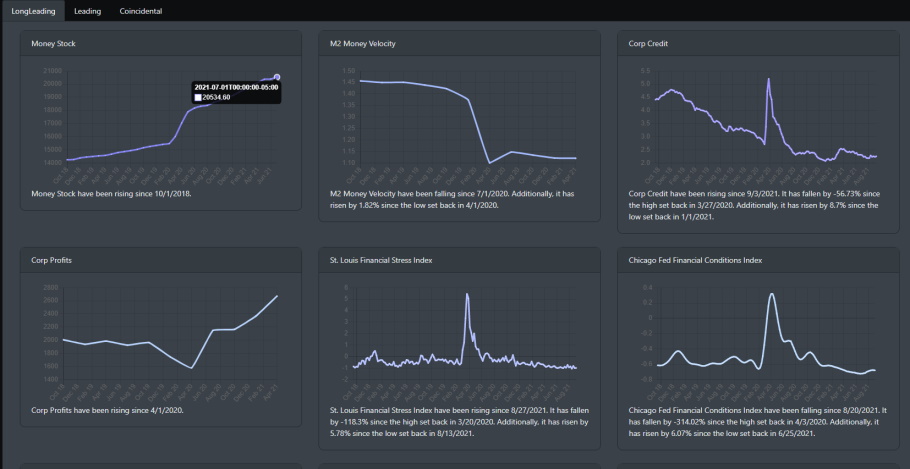
Looking at the one item below in the money stock data and it is clear that liquidity is everywhere. All that excess cash in the system has manifested itself in the following form:
- Record low mortgage rates have pushed the housing market to frenzy buy levels.
- With CD and saving rates near zero, consumers are looking to stocks to provide a better ROI.
- Even junk bonds are in demand due to excess cashing needing to find opportunities for investments,
Investors are stuck in a yield-less environment where cash is "trash". This excess liquidity is finding itself in any investment opportunity that is not sitting in a bank or CD.
Market Outlook
All major indexes were in the red this week with SPY, QQQ, IWM, and DIA all breaking key trend lines on large selling volume. On Friday, technical indicators on the weekly, daily, and intraday were indicating a bearish downturn.
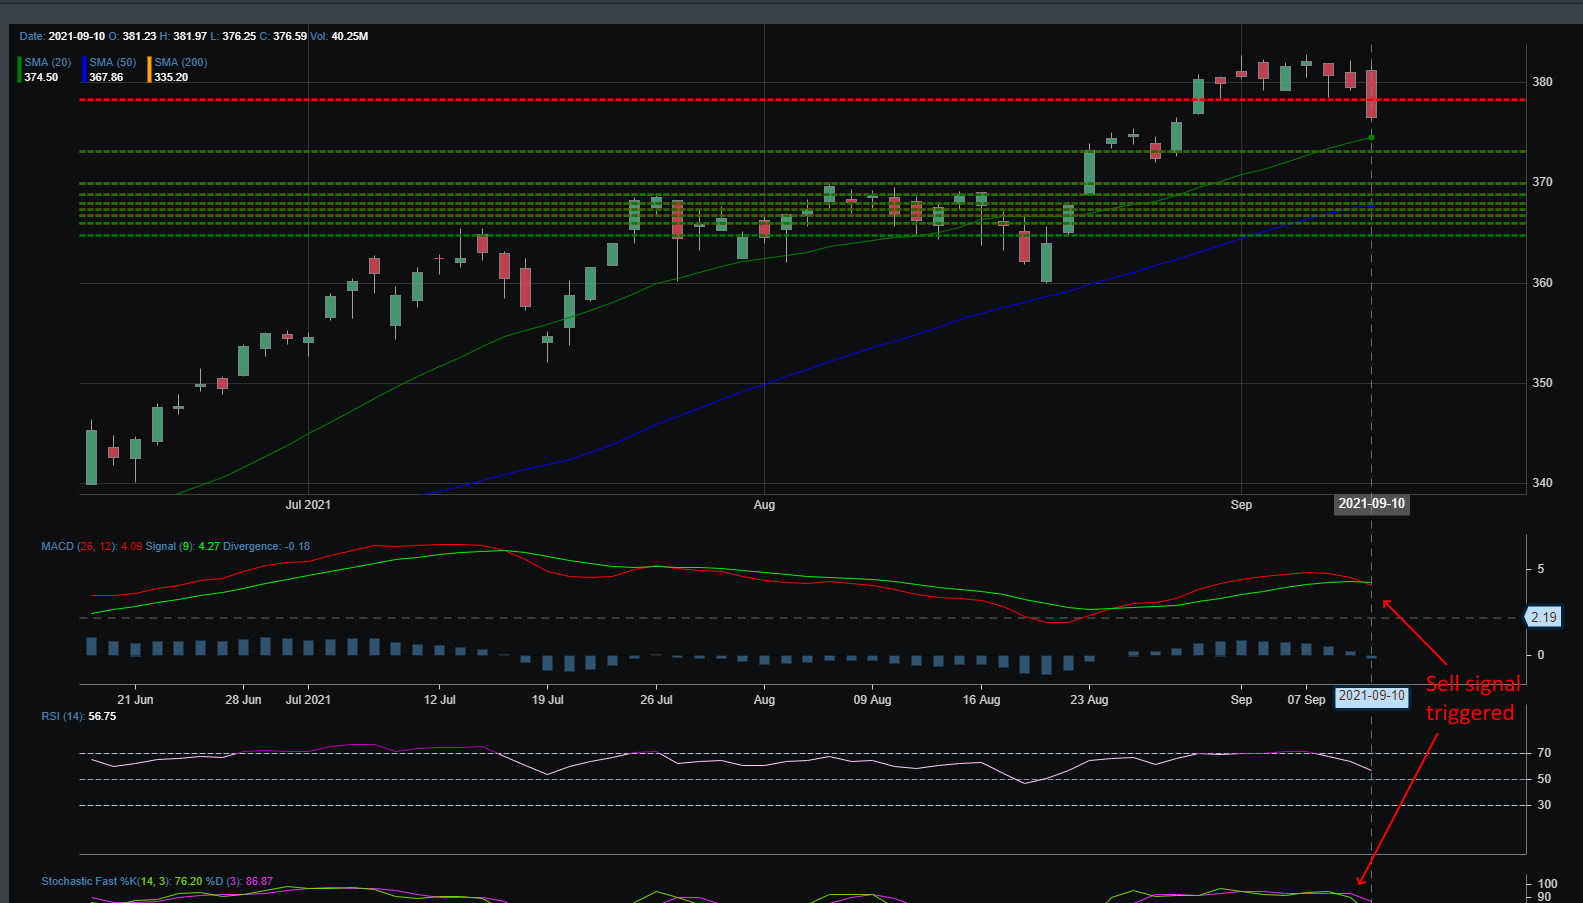
SPY
SPY broke its near-term trendline on Friday with strong selling to close out the trading week. If this slide continues, it will be looking to test its 50 DMA this week. A break lower could mean SPY could be looking at moving lower to the 420 to 430 region. The daily sell signals are triggered this week with the MACD, stochastic and momentum indicator turning bearish.
QQQ
QQQ was pushing higher during the week until Friday. It broke its near-term support and the technical sell signals were triggered on Friday.
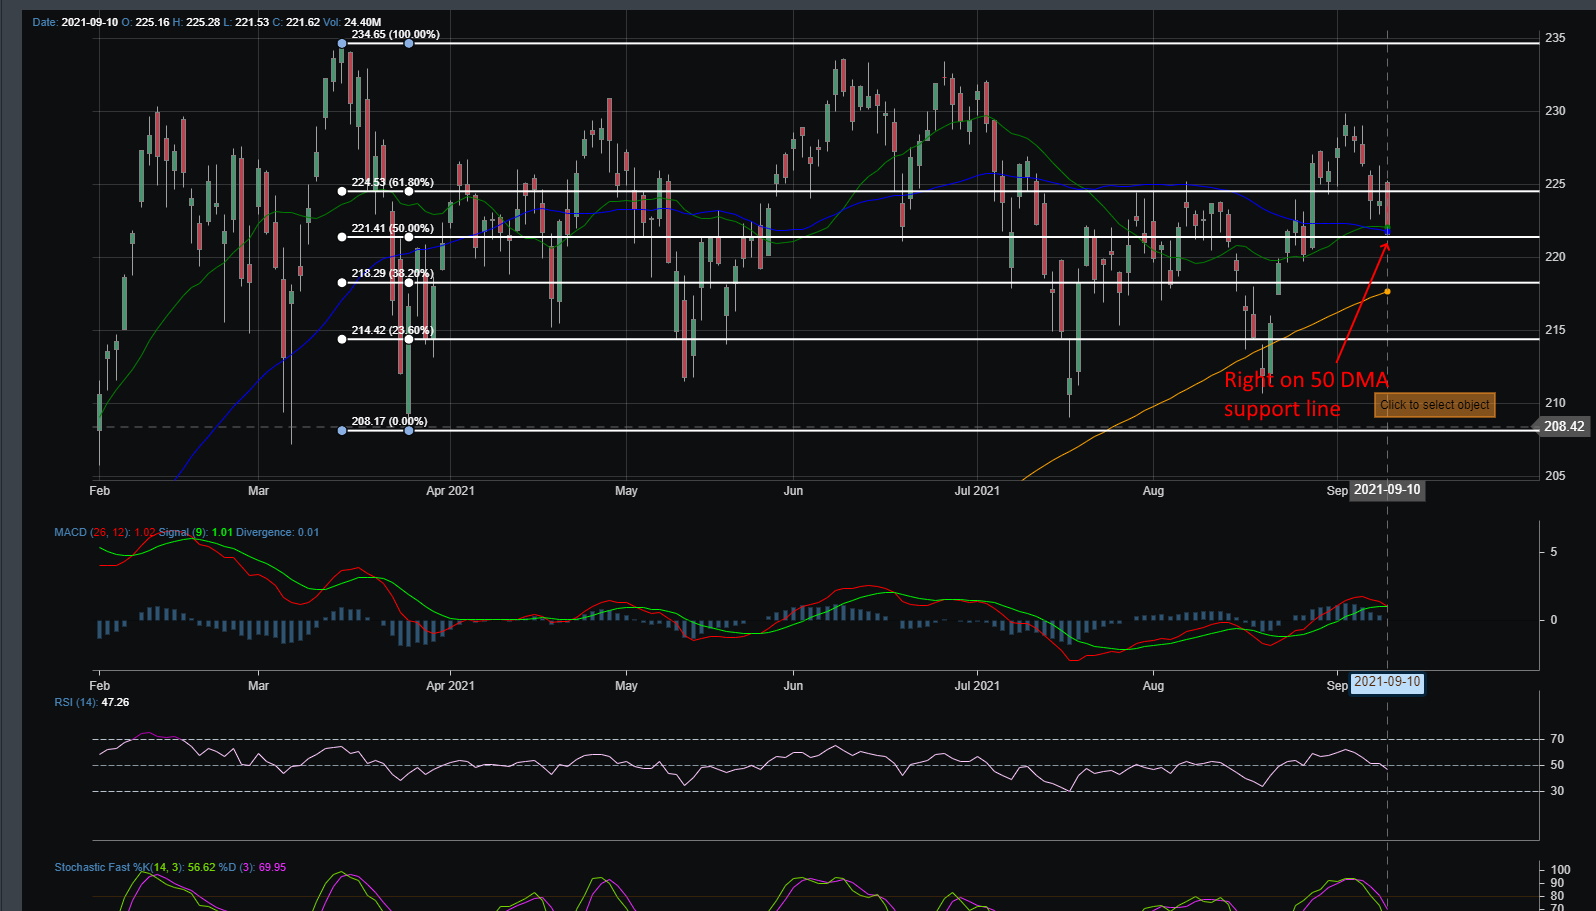
IWM
IWM has been in consolidation for much of this year. Right now, IWM is on the 50 DMA support and its technical readings have turned bearish on Friday as well. A drop from the 50DMA could mean IWM could b trading near the 210 to 215 support line.
Concluding
All indications right now are suggesting that markets are set up for a move to the downside. If markets are unable to hold the 50DMA as it has done in these past 7 dips, it is highly likely that it could move lower by 200 to 300 points. This move lower does not set us up for a bear market. The larger timeframes are still in a bullish rally and there is plenty of liquidity in the system to keep markets moving upward. This will be a buying opportunity for those who follow our blog.