


After months of declining numbers, the market showed signs of positivity over the last two weeks. Are we set to see a new bull rally? Let’s set the stage.
A new rally has been underway for the past two weeks with all major market indices posting positive weekly gains. The S&P 500 showed two consecutive gains where it closed up +4% for this week. Nasdaq, with some weaker earnings from Amazon and Apple, also rallied this week to post +2% for the week. The more senior market index, DJIA, has posted four straight weeks of gains to close out October with +14%.
If you recall from our last blog, A contrarian bounce coming?, we stated that our internal algorithms and machine learning software were pointing to a change in market direction. In that post, we commented: "...when we step back and look at all major indices on the larger time frames, we can see that the weekly technical data is suggesting the same. IWM also has not moved lower but has support around its June lows. The current readings suggest that markets are placing in a near-term bottom and a rally is forming."
Additionally, we were looking at markets from a contrarian viewpoint. "One silver lining from all of this is that the MACD for our sentiment index has been trending positive. With everyone bearish at the moment, this has the look of a contrarian move where markets will swing back up toward bullish in the not-so-distant future."
Does the current rally have any legs to move higher? Or is this one of the relief rallies where the "sell the dip" crowd comes out in full force to drop the market lower?
Big Picture
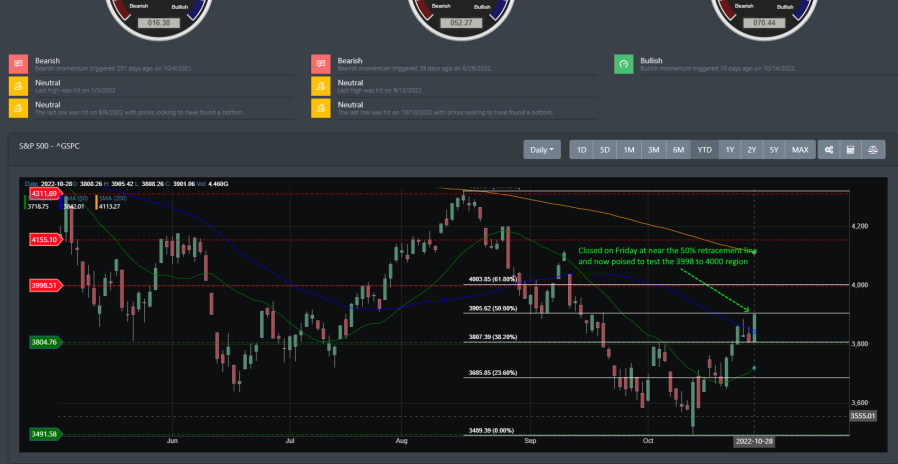
A strong market rally is currently underway with the S&P 500 moving higher from its October lows (3491.58 on October 13). Looking at the S&P 500 chart below, we can see that markets have broken through several key resistances.
One recent example can be found on October 25 when it broke through the 38.2% fib level (near ~38,07.39 region) and found support there. It then pushed higher on Friday, October 28 to challenge the 50% fib level at ~3905.62. Breaking through support, consolidating, and moving higher have not been something we have had since the June lows. Given this recent push, the "sell the dip" crowd is nowhere to be found.
Market Breadth
Getting a barometer on the overall health of the market requires data points that cover the entirety of the U.S stock universe. Additionally, building analytical observational data and algorithms to diagnose the broader market requires an understanding of near-term, intermediate-term, and larger-term market dynamics. BullGap's market breadth system allows us to view the market from a big-picture analysis and near-term market direction.
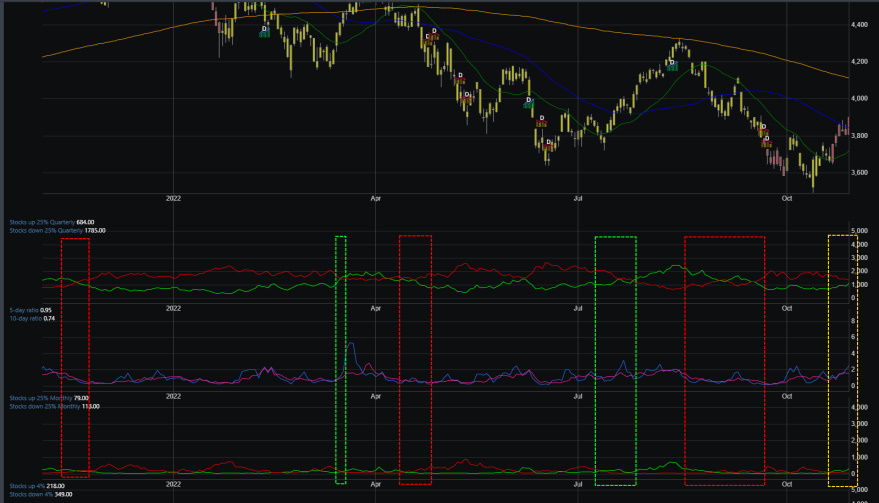
As mentioned several times this year, market breadth has been strongly bearish. Looking at the chart below, we outline the chart with three colored dashed boxes. The red-dashed boxes on the timeline show our data for stocks up\down quarterly and monthly crosses over to the bearish sides, which signifies that markets will move down. Conversely, if you look at the green dashed boxes, you can see where, when these data points cross to the bullish side, markets will move higher.
Now, let’s take a look at the most recent data. We have outlined this in a yellow dashed box. Data points now are at an inflection point where there is a possibility that they will turn bullish. If this occurs, expect markets to move higher before the year ends.
Market Sentiment
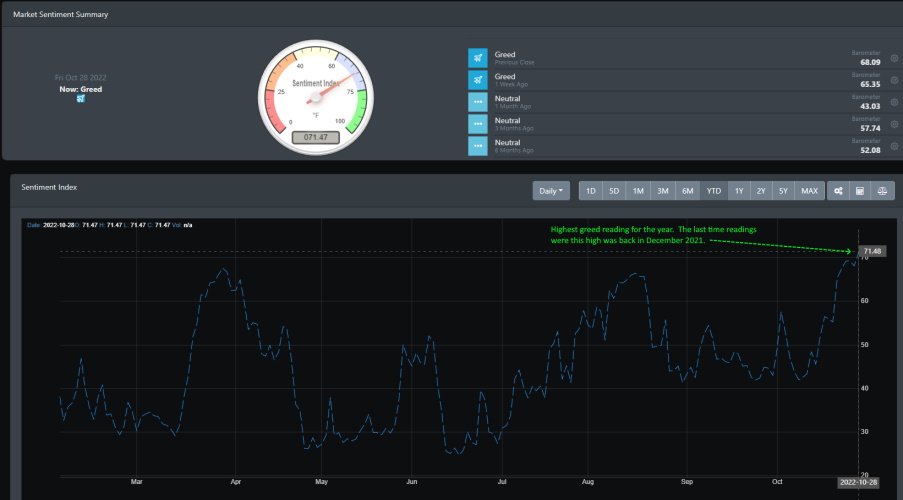
True to the contrarian trading view, the U.S financial markets have rallied while staring down the barrel of bearish sentiment from investors. Financial news for most of the year has been calling for record inflation, an impending economic recession, and a record level of put buying from traders. With the condition in place and the long stand bearish sentiment levels, Mr. Market did a reversal and now has our market sentiment index sitting at a year-high greed level of 71.47.
The last time our sentiment indicator had such a high reading was back in December 2021. Then, markets were near a topping process and were pushing higher with technical conditions in highly overbought territory. This time around, markets are highly oversold and not just from the daily readings, but from the larger time frames.
Market Outlook
For the past couple of weeks, the bulls have wrestled their way into a strong technical footing. Using the oversold technical readings on the larger time-frames, the bulls have been able to start digging into the small-caps market (IWM) and the more senior market (DIA). Technical improvements in the small-cap segment and rotational movement from growth to value stock have kept the U.S. markets from moving lower.
SPY
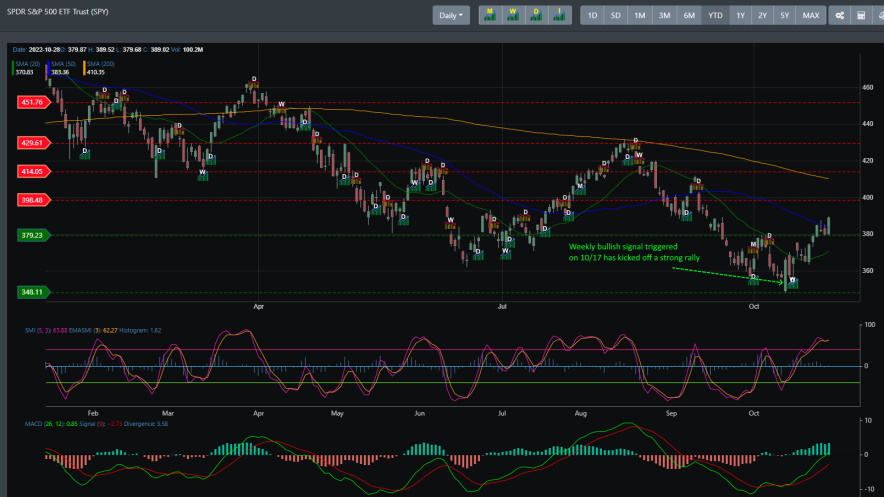
Looking at SPY on the daily chart below, you can see that the weekly buy signal was triggered on October 17. SPY rallied from that point to break through its initial resistance at 379.23. It closed Friday's trading session sitting right at 389.02 (above resistance which has now become support). It has also broken through its 50 DMA and is poised to move higher to challenge the 398.48 resistance line.
DIA
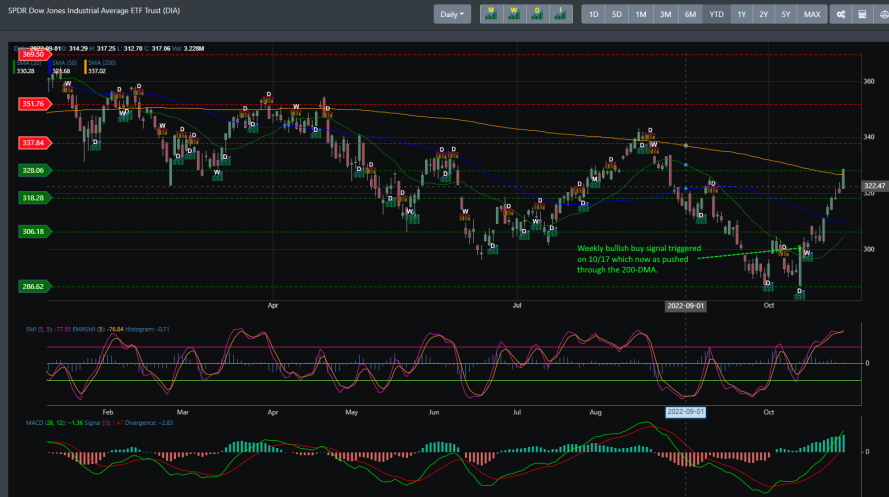
Like SPY, DIA also received a strong weekly bullish buy signal on October 17. Unlike SPY and QQQ, it did not receive a monthly bearish signal in October. In fact, it already had a stronger technical reading than all the other major ETFs. This is one reason why DIA blew past several key resistances to challenge its 200 DMA, as displayed in the chart below. While all other indices are still below its 200 DMA, DIA closed on Friday above its 200 DMA.
IWM
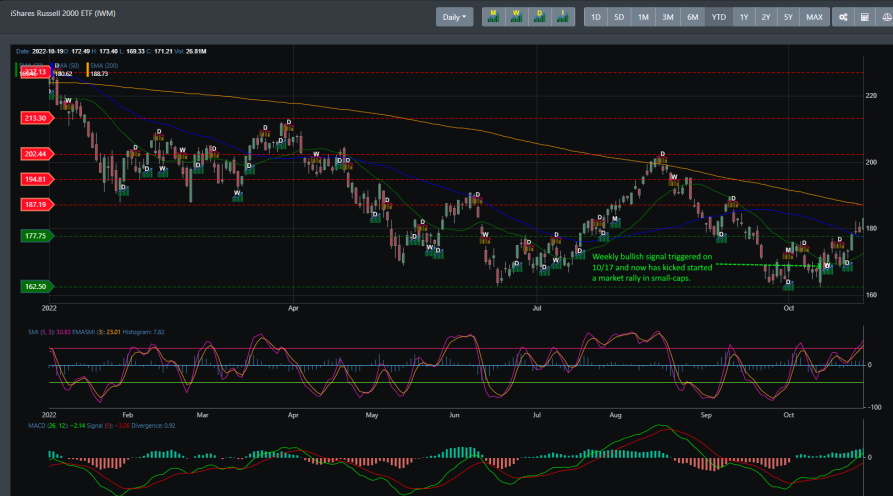
Similar to the other major indices, IWM also received its bullish weekly buy signal on October 17. Unlike the SPY and QQQ, for the past month and a half, IWM has been finding support near the 162 region. Because of this, momentum has been moving higher to the point where the weekly MACD has been triggered for this week. This strong technical improvement in the small-cap segment of the stock market can be foretelling as it is usually a leading indicator for the stock market in both directions. Right now, IWM is flashing a strong buy.
Concluding
Financial markets move in cycles and we can see that in underlying data points. The reversal patterns, whether they are bullish or bearish, will eventually line up where all major market indices flow in the same direction. Since the start of 2022, all major markets have been in a downtrend, as seen in the larger time-frames where this occurred in 2018 and 2020, and now in the bearish market of 2022. Now, the weekly time-frames for all major markets are in the oversold territory with a near alignment toward a bullish reading. Note, however, that the monthly timeframe is still bearish.
With the bullish technical setup in place, the current rally looks to have more momentum to push higher. However, up next is a test for which the bulls failed to push higher back on August 16. That comes around the 3998 to 4010 region and this scenario sets up the bull for a re-test of the 200 DMA. But before we get there, with the recent daily readings at near-oversold, there should be an expected pullback in the very near term. If the bulls are going to really challenge the bears, then prices need to stay around the 3800 region. And as long as prices consolidate on this support and the rally continues, there is a good chance the next target is the re-test of the 200 DMA.