


This week, investors got a jolt as the market started to correct itself with the S&P 500 wrapping the week up in the negative territory. The S&P is still up +12% YTD but this week's closing was its worst since 2/22/21. With a hairline of 20+ points, the Nasdaq lost its 4-week winning streak and the Dow Industrial closed the week with -3%. As we discussed in our last blogged, there was potential for a drop with technical momentum indicators issuing a sale signal.
One big backdrop for this week was the Fed meeting where they announced a possibility of 2 rate hikes for 2023. What is different with this news is that previously the Fed was bullish in their stance on supporting the market with unlimited QE. It looks like the Fed may be suggesting that they plan on tapering sooner rather than later. Many will use this as ammo to validate that a market top is here and a major correction is pending.
What we see and what we have discussed before is that this the recent volatility and dip in the market has been due to a large rally that occurred last year. We are still in a BULL market and right now markets are consolidating gains. The S&P 500 alone has rallied ahead with 3 new highs in the past couple of weeks. The economic data is showing a global expansion.
Big Picture
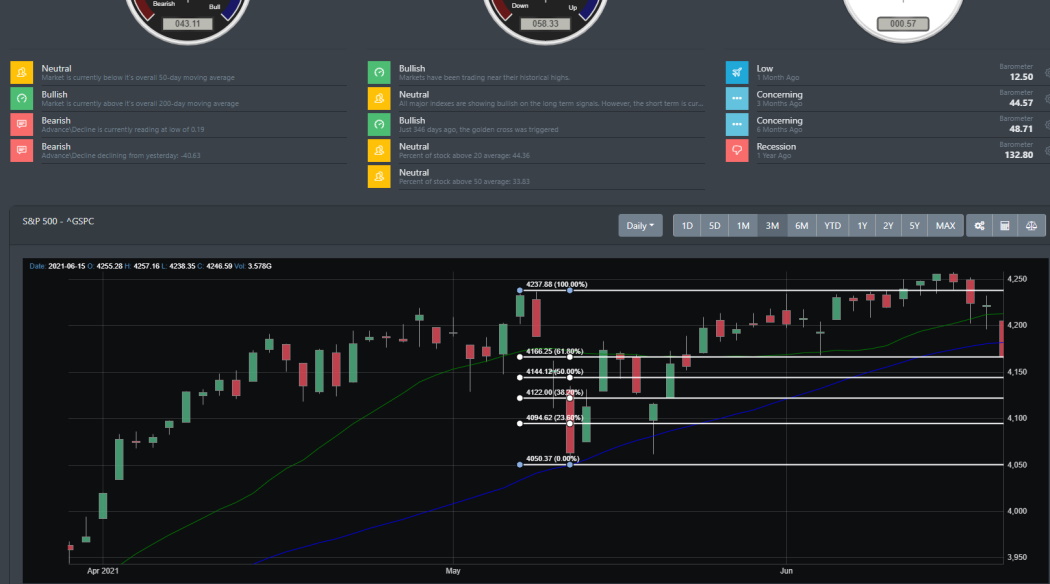
S&P 500 started the week off strong where it added another record high of 4255. Nasdaq has forged a record high as well. For the most part, the S&P 500 was hovering above support until Friday's trading session. Friday's dip caused the S&P 500 to break its near-term support and there is still plenty of downward pressure to suggest that it dropped further.
Below, we show several supports that most likely will need to hold if the market is to reach what we believe 4300-4400. The next support is 4150 area. If that support breaks, we expect it to drop to somewhere between 4050 and 4100.
Market Breadth Table
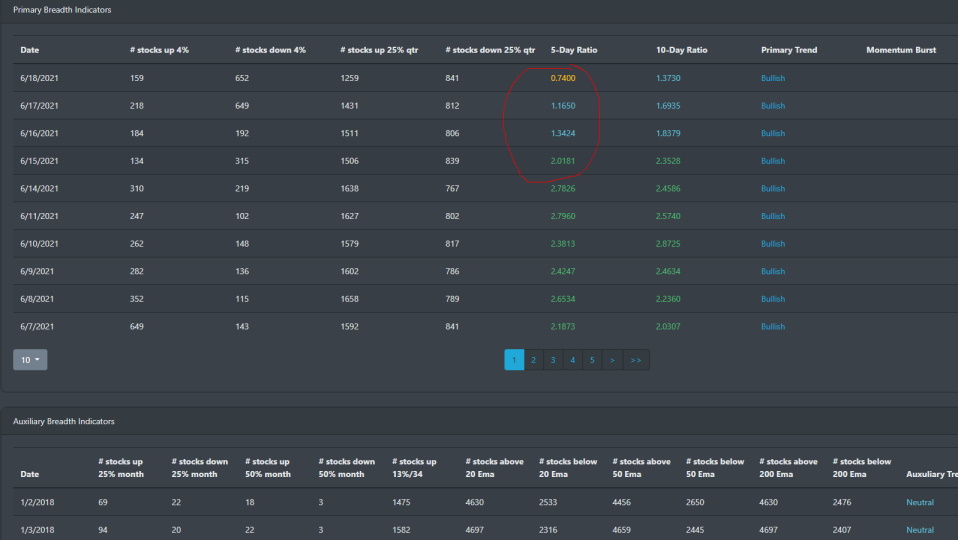
Market breadth started to switch gears on Tuesday of this week. The 5-day to 10-day ratio inverted and the market internals started to weakened as all major indices started to dip into the later part of the week.
Market Breadth Chart
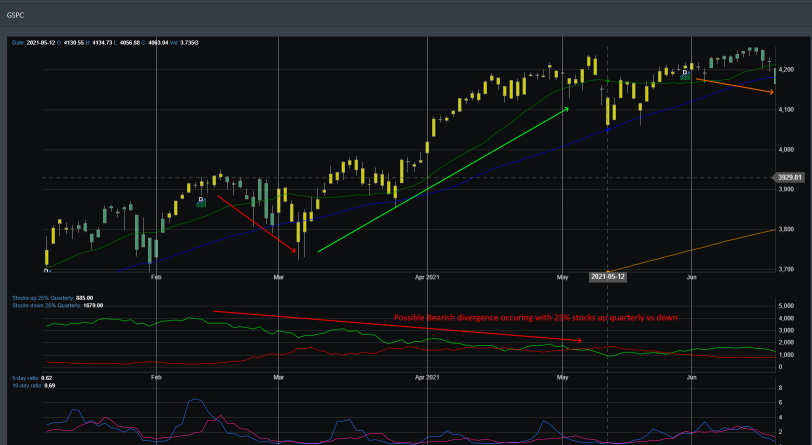
Interesting enough, if we look at the last Bullish momentum that was triggered in mid-February, there was a dip as well in the market. After that, the market rallied in March to all-time highs before consolidating in May. We can see the market rally starting to slow down as the 25% stock up down ratio started to decline. Now, it looks like the market is about to take a small dip before continuing on with the march to 4300-4400.
Market Sentiment
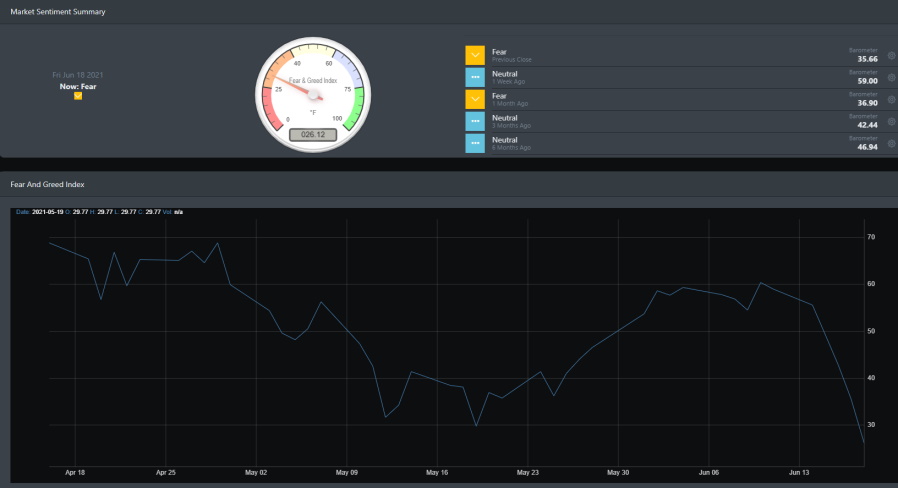
In a matter of 2 weeks, the market went from neutral to Greed. This occurred in late May and into the better part of June. It only took a couple of days for the market to switch gears and dropped into the fear territory. The reading of 26.12 is one of the lowest readings since the end of January 2021.
Economic Outlook
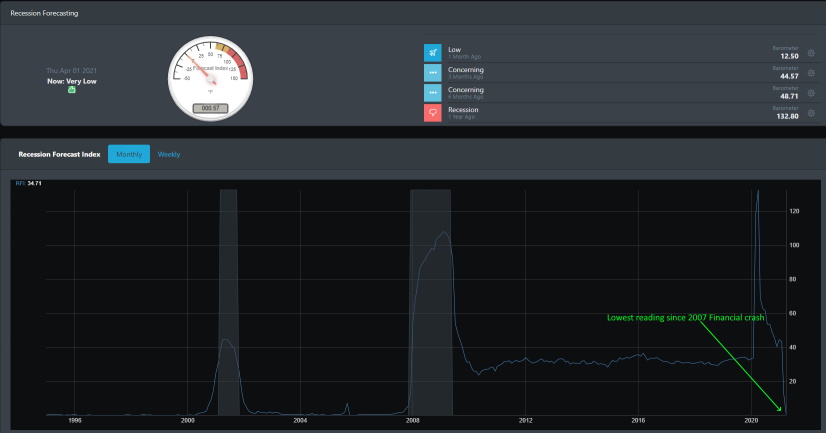
BullGap's recession indicator is now reading one of the lowest values since the pre-2007 Financial crash. This is certainly a drastic change from a year ago when the pandemic hit. While the 2007 recession lasted roughly 18 months, the 2020 "recession" recovered in less than a year.
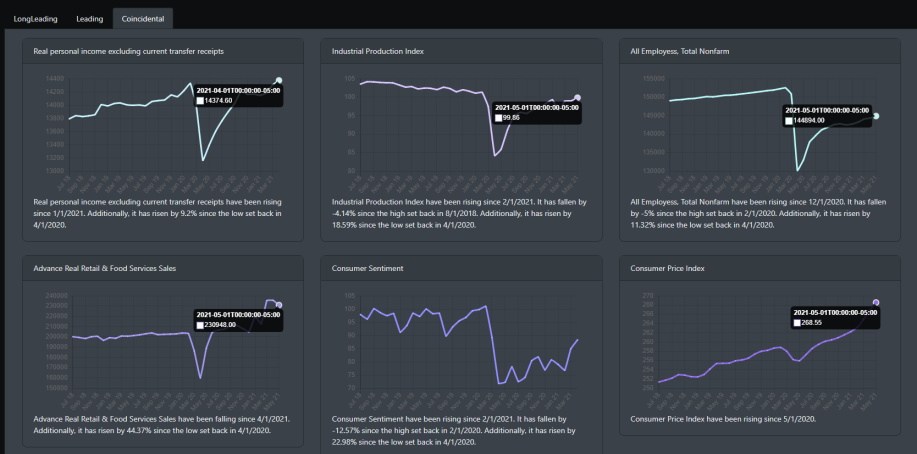
The economic data is looking positive for areas in Retail, production, and consumer sentiment. Below, we can see that the U.S retail and food service sales are +28% from May 2020. Total sales for March 2021 to May 2021 were +36%. Retail and restaurants are regaining all their losses for 2020. Industrial production also increased in may by .8%. The only outlier and something we have discussed in prior blogs are that of the employment data. All employees (total nonfarm) still show that we are nowhere near pre-pandemic levels. The data indicates that it has plateaued for most of the year.
Market Outlook
This week, all major indices were lower. Small-caps (IWM) and micro-caps were one of the primary losers for the week. The Dow was not far behind. The treasury market on the other hand rallied this week. This is a headscratcher as there has been so much news regarding the rise in inflation. Rising inflation is typically a threat to TLT as bond yields rise. It seems as if the Treasury market had the case of short-term amnesia.
SPY
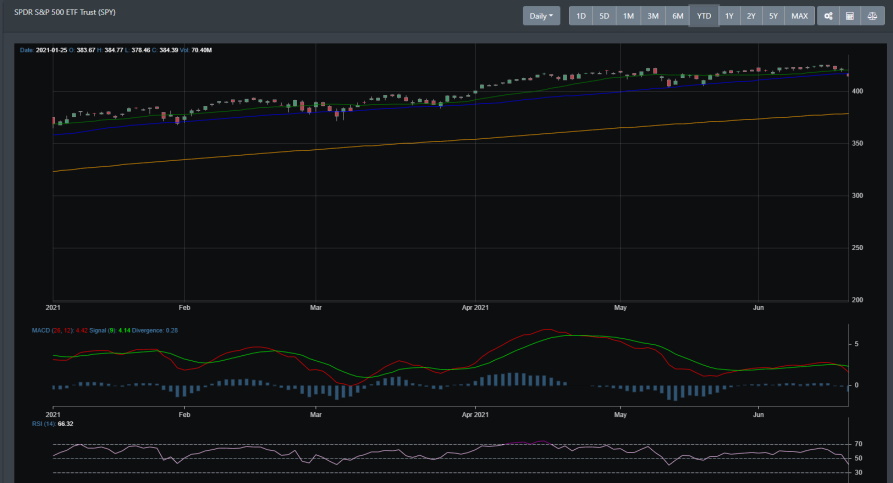
SPY broke key support. It is currently sitting right under the 20 and 50 DMA. The MACD sell signal was trigger this week and there is technical weakness on the weekly and daily readings. SPY looks like it has more room to move lower.
QQQ
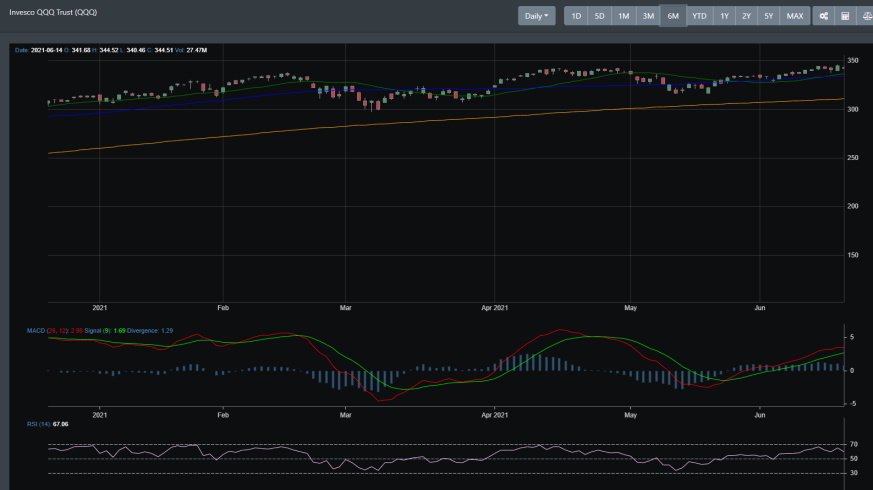
While QQQ lost this week, it has been a strong performer for the past few weeks. On Friday, there are some bearish signals showing up on the intraday charts. That said, QQQ is still looking bullish.
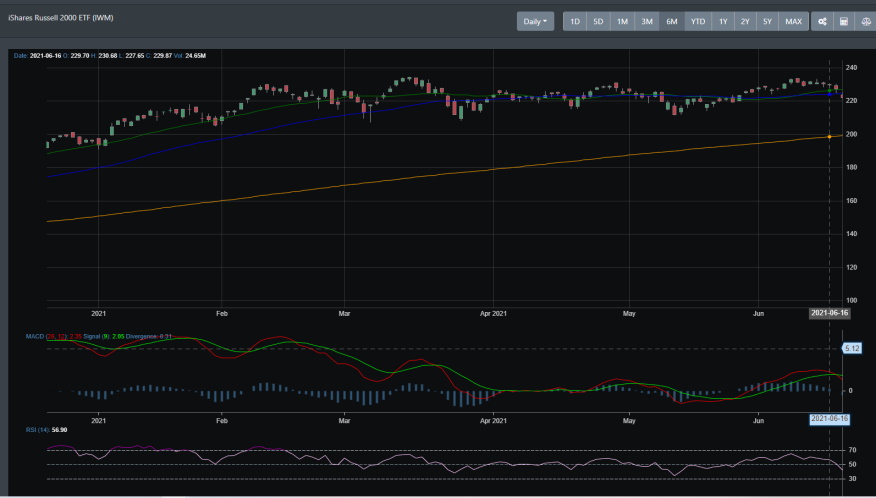
IWM
IWM has had a strong rally to start June but it sold off for the better part of this week. Like SPY, the weekly and daily charts are looking bearish.
Concluding
With the FOMC meeting and the market dipping this week, there are plenty of pundits now coming out and calling for a market top. Having the FED message that they will look at tapering QE policies in 2023, they are now convinced that a large market correction is right around the corner.
For BullGap, we actually view the Fed discussion as more of a positive for equities. As we discussed last week, there were data in the charts to indicate a dip coming. However, just as in any rally, a market dip is healthy and ensures the continuation of the Bull market. As discussed above, there still exists selling pressure on the S&P 500 and it is possible that it may dip down to near 4000-4100 support. However, we expect the market to rally up to 4300-4400 after that.