


With an endless number of bad news floating around in the markets, market participants have quite a bit to think about as it relates to the market and their portfolio. The wall of worry has many names now. Fed raising rates and QE tightening, inflation running "HOT", recession scare, tech sector fallout. All of these have been in the news for much of 2022. And a new one that has recently been in the mouths of market pundits is that the market is now in a bear market. Now, everyone is looking at the market through the lens of a bear participant and is preparing themselves for a market crash.
If this is true, then this would be one of the most anticipated market crashes since the S&P 500 was introduced.
Big Picture
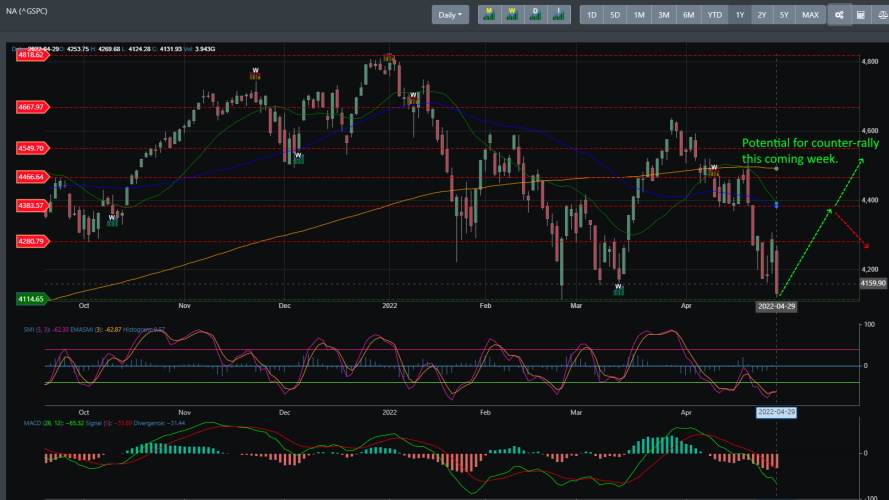
Let's look at the market through the lens of our TrendFinder algorithm. On January 3, 2022, TrendFinder issued a monthly sell signal that states market internals has changed at the larger timeframe. Historically, when this signal is triggered, we see a topping happen a week after this signal but markets clearly dropped a couple of days after the signal was triggered on the S&P 500. Markets slide and bottom on February 24 and consolidated near the 4114 region. On March 14, TrendFinder issued a weekly buy signal that then saw the market accelerate to hit the 4630 area before topping out. This counter rally was short-lived and literally brought technical conditions into the overbought territory. Today, markets are now near the retest of that February 24 low.
Market Sentiment
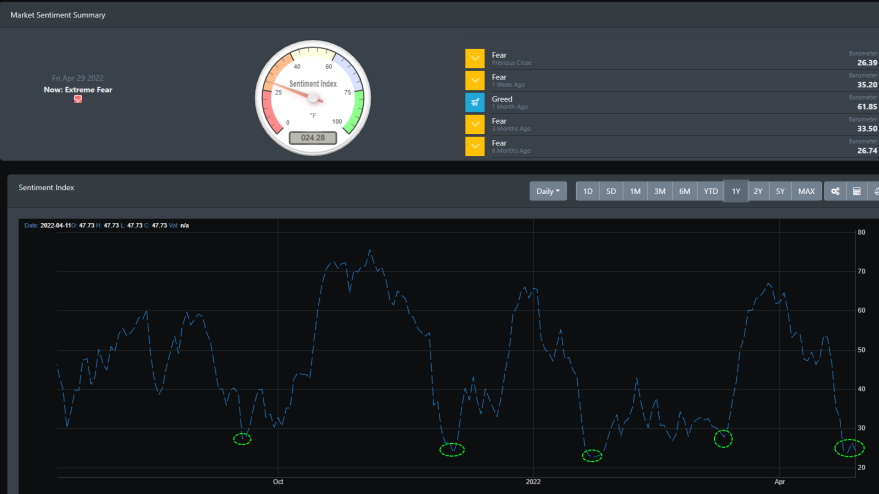
Market sentiment is now in the fear mode and the current sentiment reading from BullGap's market sentiment index is at a low of 24.28. Are markets ready to drop more? Possibly but all indication shows that markets are ready to hit a counter rally this coming week. Looking at the image below, for the past 6 months, every time our market sentiment has dopped near the 20 lows, there has been an immediate counter-rally that follows. Sentiment levels at this level typically indicate sellers are exhausted and this can be viewed as bullish from a contrarian standpoint.
Market Momentum Timer
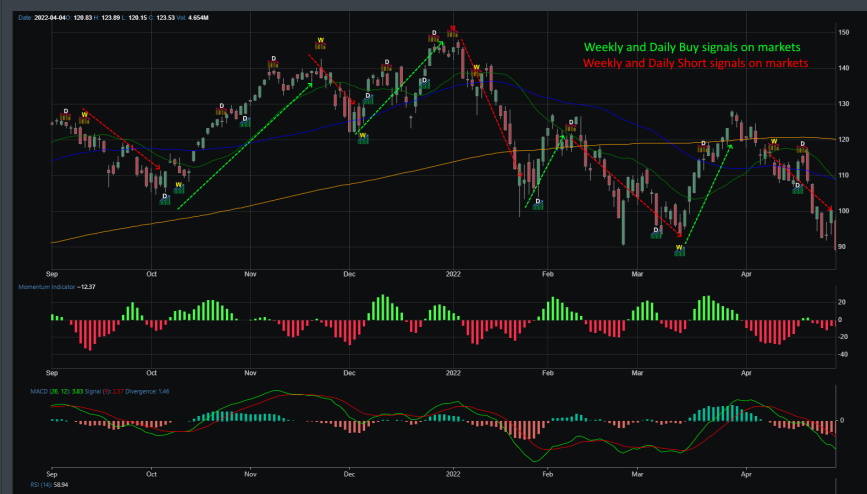
There is one powerful tool we use here at BullGap to help guide us on market trends. We use it for going long or short on the stock market. Looking at the image below, you can see that when there is a weekly or daily buy signal (white letter D (daily) icon or yellow W (weekly) icon, we are long on the market. When there is a red weekly or red daily sell signal, we sell out of our trade and short the market. Looking at the past year, we can see this has served us well. And in fact, it has served us well for many years. However, what we want to show here is that right now, markets are definitely in a downtrend. The most recent signal is bearish and indicates a downtrend in the market. The momentum index is bearish but readings have not been overwhelming recently.
Concluding
Markets have clearly been trending lower since the beginning of the year. To put things in perspective, all major indexes have been in a rally for almost 2 years. Starting mid-April 2020, the S&P 500 has rallied to all-time highs and is up 85%. Consolidation and an expected pullback from such a rally are what we would expect to see. Though if one was looking from the lens of war, COVID, inflation, Fed QE tightening, it would be hard to see anything but a bear market.
Markets are clearly trending lower. However, with technicals in oversold territory and market sentiment offering a contrarian stance, there is a high probability that there is a counter-rally coming this week. It is most likely limited to direct resistance above which stands at 4383. However, if it can find support around this area, we see more upside to the rally. However, it is possible that this counter rally may stop out at around the 4300 region.